
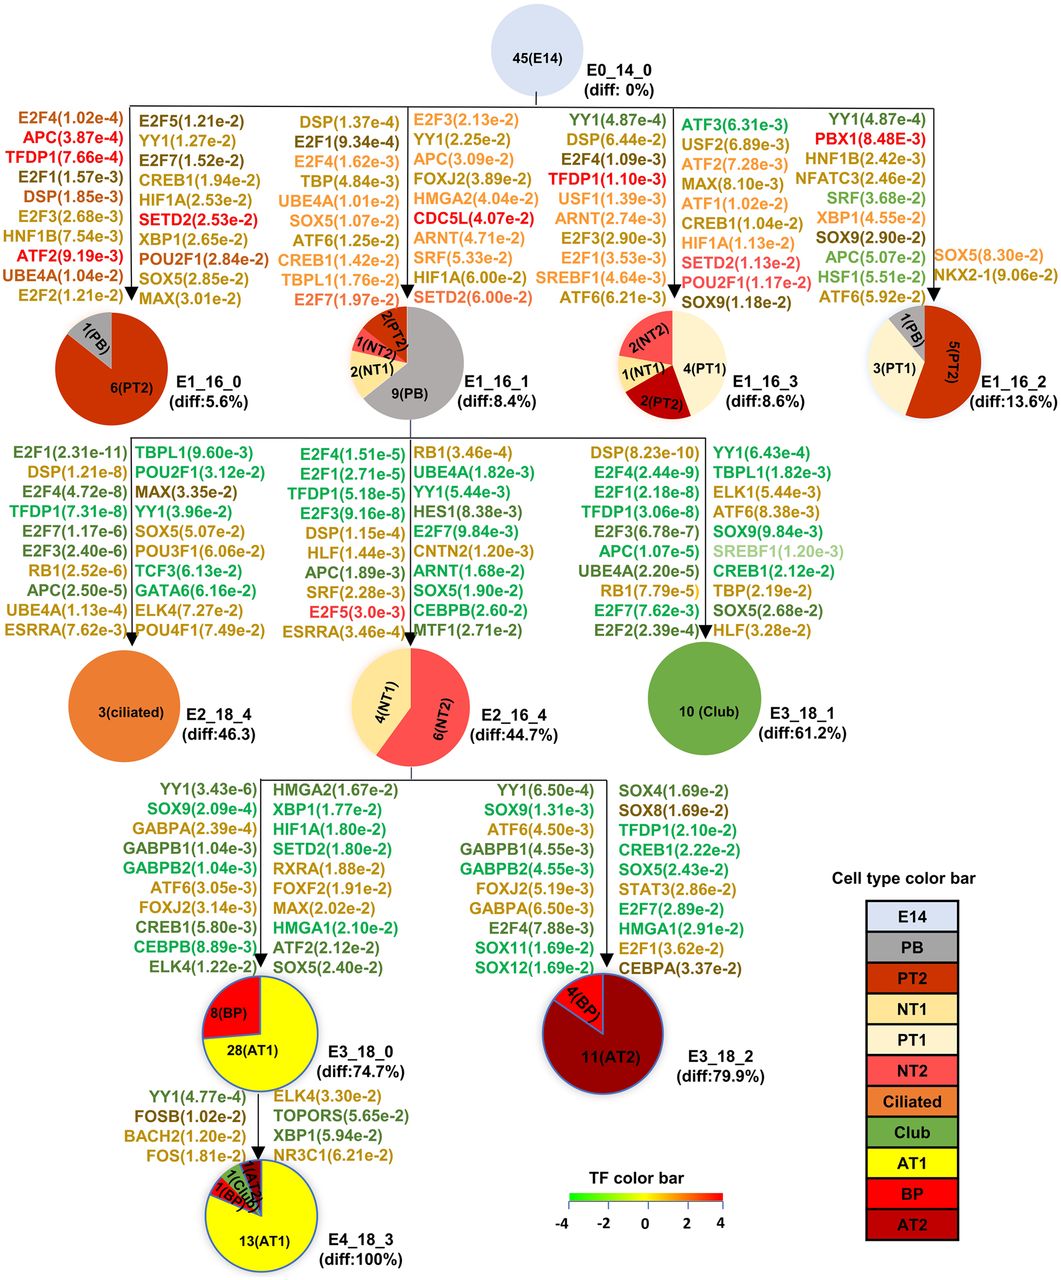
Figure 3.
Differentiation model using data from both Treutlein et al. (2014) and Du et al. (2015). Cell types taken from both Treutlein et al. (2014) and Du et al. (2015). (PT2) Proliferative AT2 early precursor; (PT1) proliferative AT1 early precursor; (PB) proliferative bipotential precursor; (NT1) noncycling AT1 precursor; (NT2) noncycling AT2 precursor. Differentiation scores, TFs color, and P-value have the same meaning as in Figure 2.


