
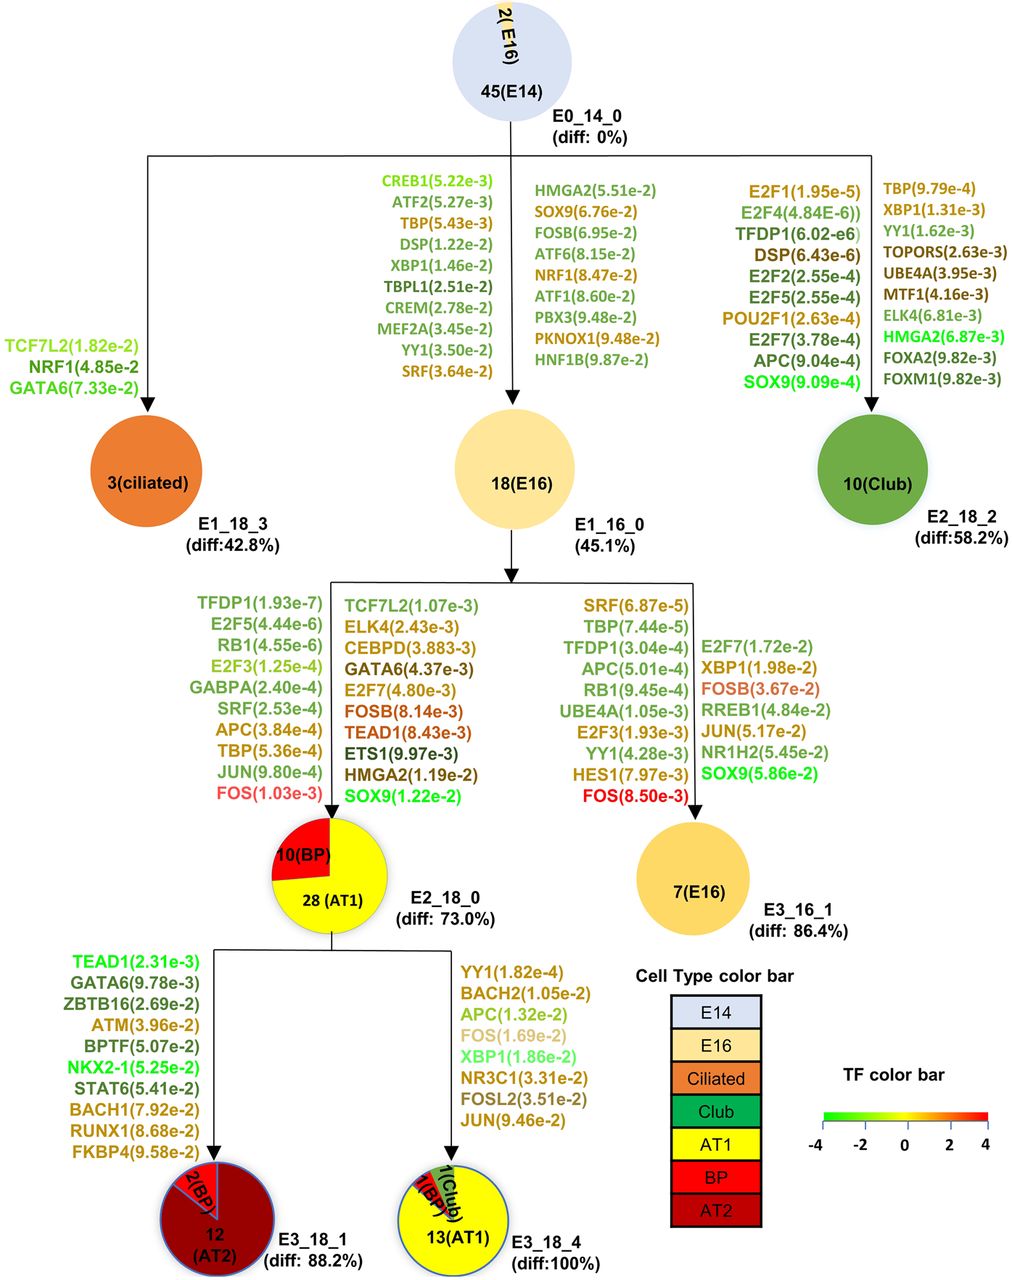
Differentiation model on Treutlein et al. (2014) lung single-cell data set. (diff) Differentiation stage 0% (most undifferentiated)–100% (most differentiated) from the first state. Number of cells assigned to each state was given inside the pie chart. Cell types for each state (node) are based on the assignments of Treutlein et al. (2014) and so are only available for cells in the last time point (E18.5); cells from earlier time points are labeled using the time point (E14, E16). TFs are associated with paths they are predicted to regulate and color-coded based on their expression change (fold change) along the regulated path. TF P-values are based on the set of targets associated with the states they are predicted to regulate.


