
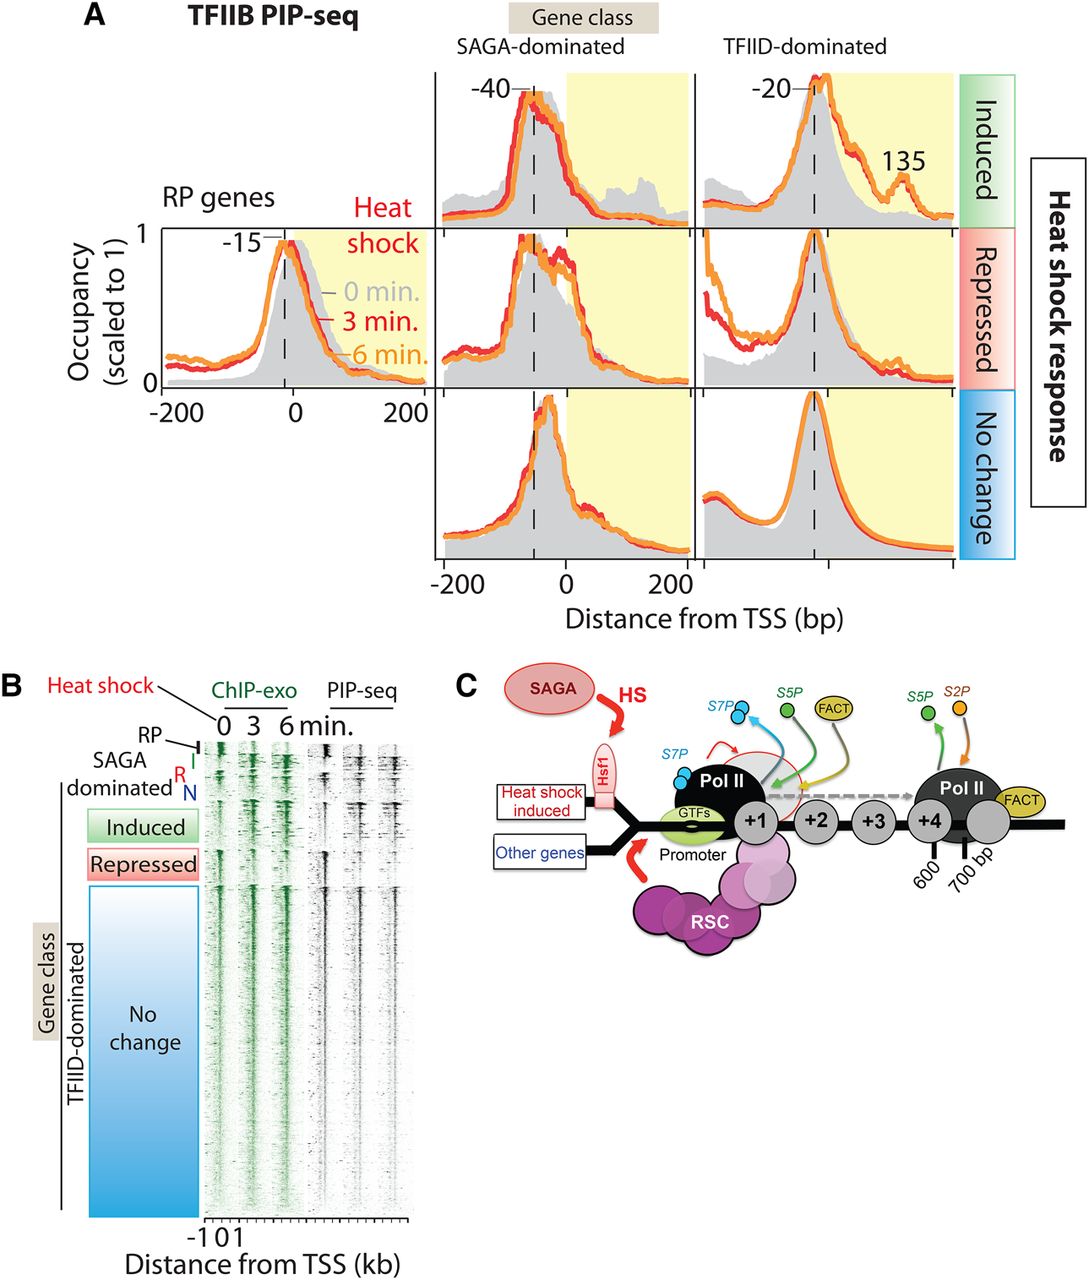
Melted PIC DNA is unaffected by Pol II accumulation in promoter regions. (A) Gene-averaged plot of TFIIB PIP-seq tag 5′ ends separated by gene class and heat shock response (i.e., changes in TFIIH occupancy). Mock, 3-, 6-min time points are indicated (gray fill, red trace, orange trace, respectively). Transcription is oriented to the right. Plots are scaled to 1. Transcribed regions have a yellow backdrop. Dashed line indicates position of transcription bubble upon heat shock. (B) Heat maps of TFIIB (Sua7) ChIP-exo (green), and PIP-seq (black) at 0, 3, and 6 min of heat shock. Gene classes are as in A. (C) Model for heat shock-induced reorganization of factors at most genes whose expression does not change, and genes whose expression is heat shock-induced.


