
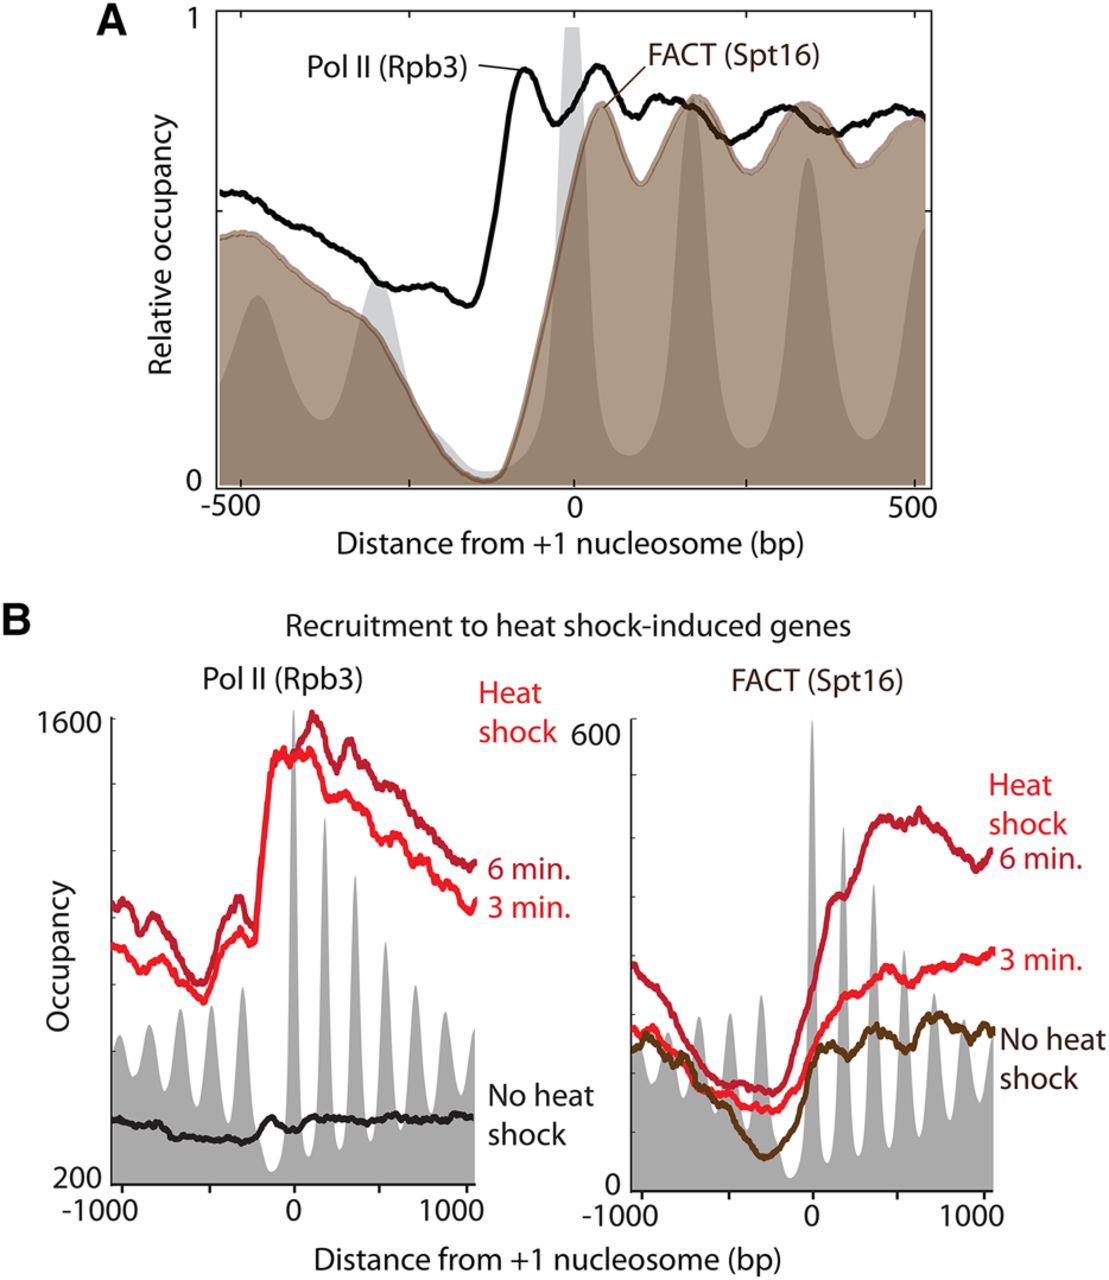
Figure 6.
Relocation of FACT upon heat shock. (A) Frequency distribution of gene-averaged ChIP-exo tag 5′ ends for PoI II (Rpb3, black trace) and FACT (Spt16, brown fill). Gray filled plots correspond to nucleosome dyads. Coding transcription is oriented to the right. Plots are separately scaled to 1 for each data set. (B) The absolute occupancy (normalized tag 5′ ends) of Pol II (Rpb3) (left panel) and FACT (Spt16) (right panel) were averaged at heat shock-induced genes (as defined by increased TFIIH occupancy).


