
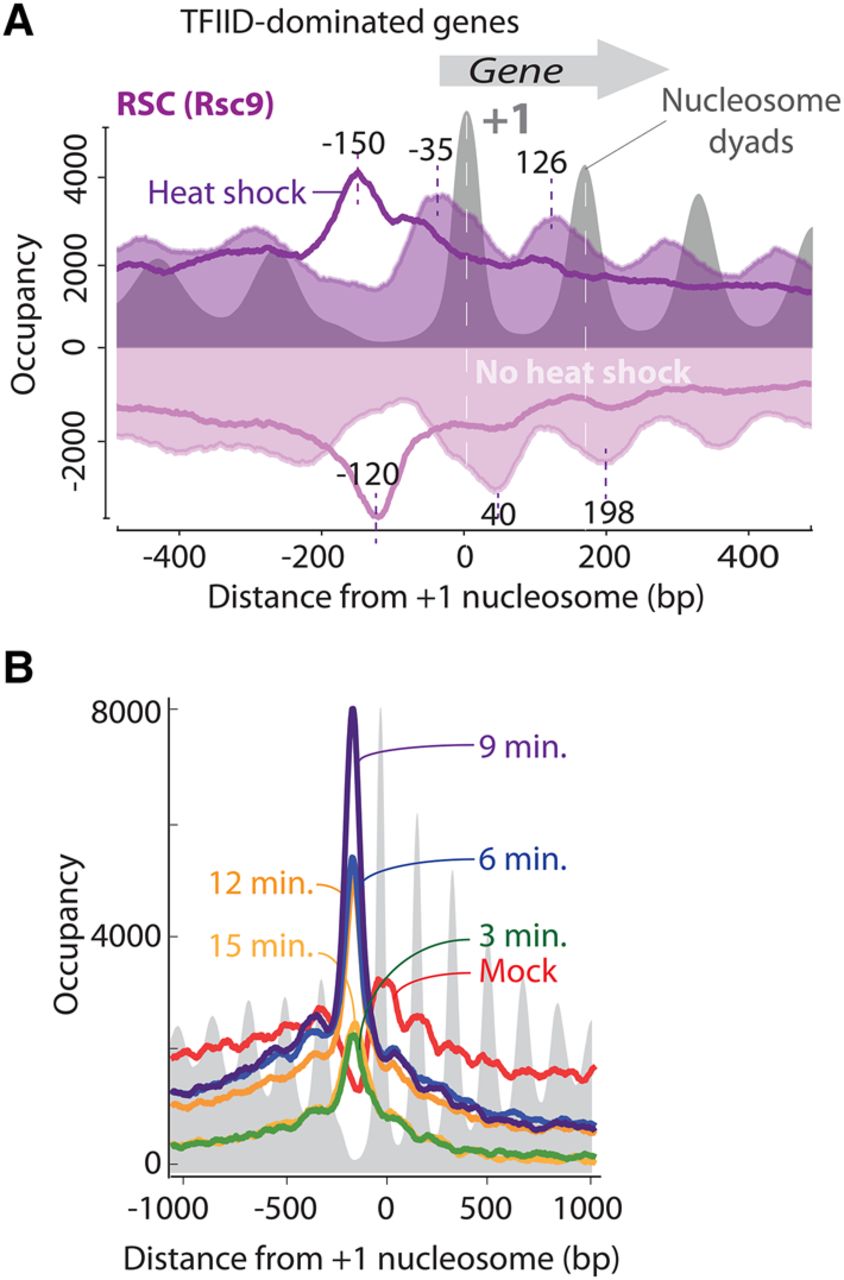
RSC (Rsc9) relocates from gene bodies to promoters upon heat shock. (A) Averaged distribution of Rsc9 (normalized unshifted strand-separated tag 5′ ends) plotted with respect to +1 nucleosome dyads at all TFIID-dominated mRNA genes (n = 4260). Transcription is oriented to the right. ChIP-exo tags mapping to the antisense strand are inverted. Semitransparent purple filled plots represent mock heat shock, and dark purple traces represent acute heat shock (37°C for 3 min). Gray filled plots correspond to nucleosome dyads prior to heat shock which do not change in this bulk assessment upon heat shock. RSC peak distances (in bp) from the +1 dyad are indicated. (B) RSC (Rsc9) gene-averaged distribution of normalized shifted tags mapped with respect to +1 nucleosome dyad showing occupancy during mock heat shock (red trace), and a time course of acute heat shock (37°C) for 3, 6, 9, 12, and 15 min in green, blue, magenta, orange, and dark orange traces, respectively. Nucleosome dyads are shown in gray fill.


