
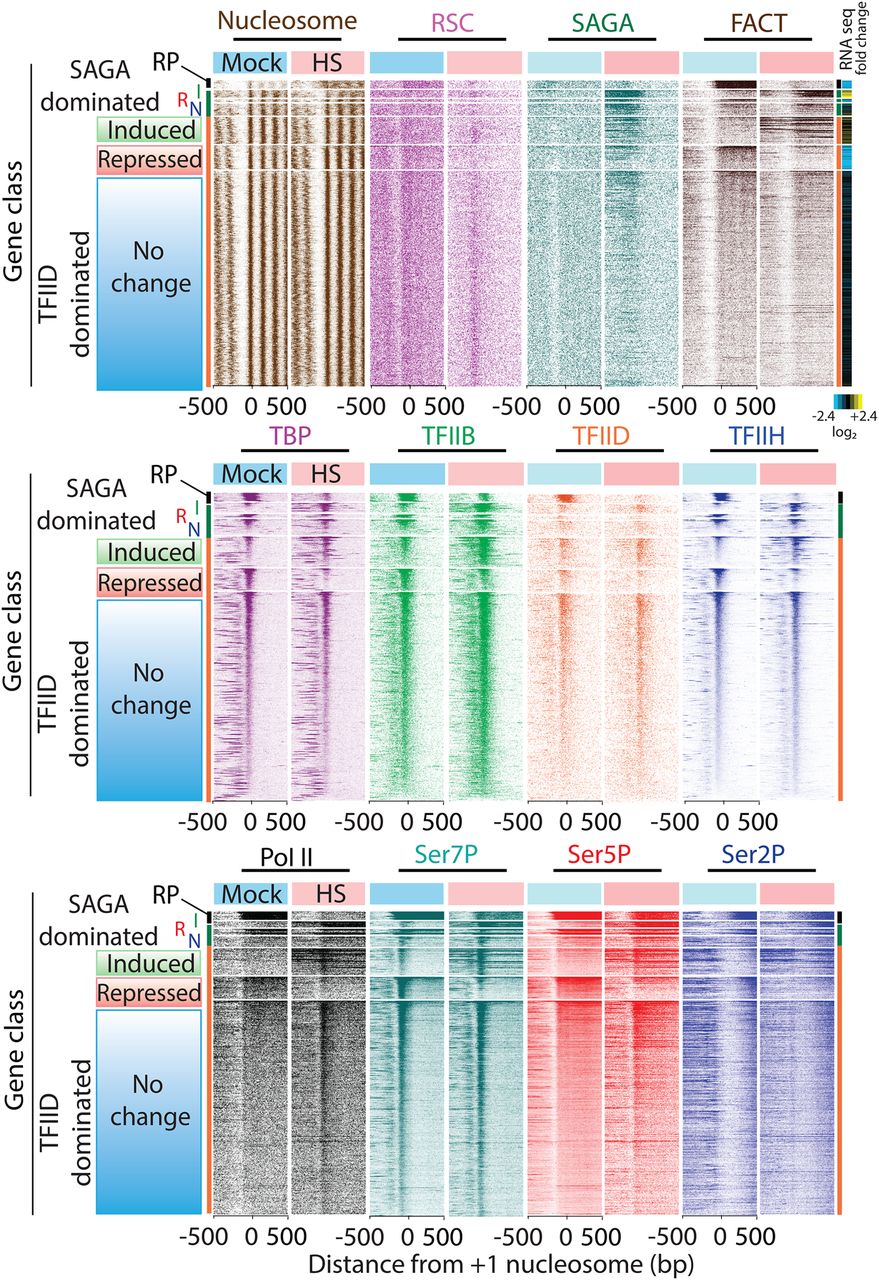
Segregated and sorted heat shock response. ChIP-exo tag 5′ ends were plotted from ±500 bp relative to +1 nucleosome dyads, panel-separated based on mock or 3 min of heat shock, segregated by gene class (RP, SAGA, TFIID) and then by increased/induced (I), decreased/repressed (R), or no changes (N) in TFIIH (Ssl2) occupancy upon heat shock: SAGA-dominated genes (I,R,N, n = 160, 55, 252, respectively), TFIID-dominated genes (I,R,N, n = 488, 353, 3358, respectively). Within each segregated group, rows were sorted by TFIIH occupancy in the region 100 bp upstream of to 100 bp downstream from the TSS. Also shown in the far upper right is a heat map of log2 fold-changes in mRNA expression after 15 min of heat shock, using data from Yassour et al. (2009).


