
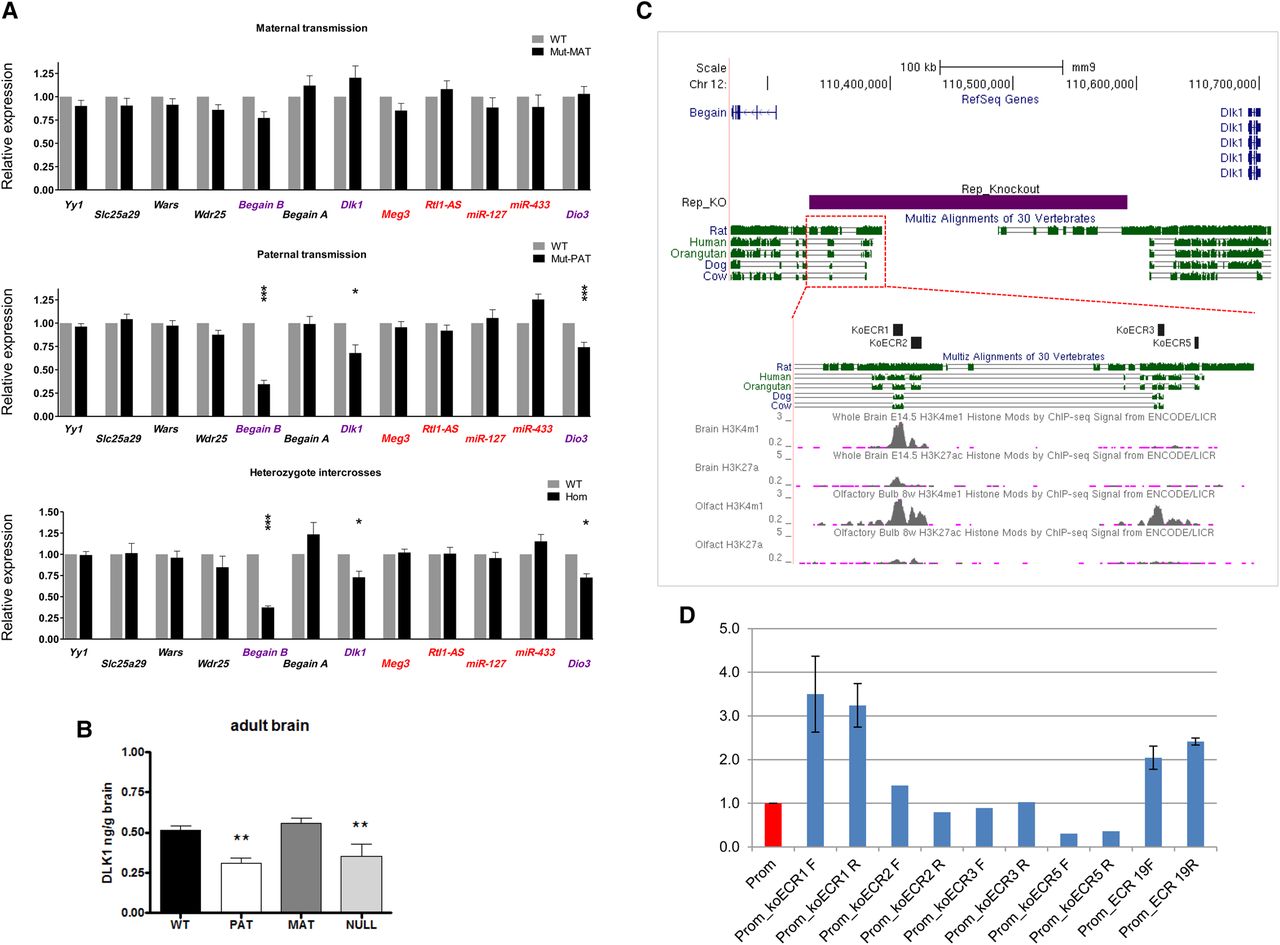
Paternal transmission of delL1rep results in temporal- and tissue-specific disruption of imprinted gene expression on the paternal chromosome. (A) Relative expression of five biallelic genes closest to the deleted interval (black) and of the transcripts within the neighboring imprinted cluster ([blue] paternally expressed; [red] maternally expressed) in fetal (E16.5) brain, as determined by RT-qPCR. (Upper) No significant differences in expression were observed upon maternal transmission of the delL1repallele (n = 12 wt, 14 mut; four litters). (Middle) Paternal inheritance of the delL1repallele elicited a significant down-regulation of all of the paternally expressed genes (n = 13 wt, 13 mut; four litters). (Lower) The effect of delL1repon the expression of Begain b, Dlk1, and Dio3 was closely recapitulated in homozygous mutants (n = 12 wt, 13 mut; six litters). Maternally expressed miR-127 and miR-433 are part of larger transcripts (Rtl1-AS and Mirg, respectively) but have their own promoters and can be independently transcribed (Song and Wang 2008). Data were normalized to Gap3dh expression and are shown relative to WT controls (=1). (*) P < 0.05; (***) P < 0.001 by two-tailed Student's t-test. (B) DLK1 ELISA performed on wild type (WT), paternal transmission of delL1rep (PAT), maternal transmission of delL1rep (MAT), and homozygous adult brains (NULL). DLK1 protein levels in PAT and NULL are significantly lower than wild type: (**) P < 0.01 by ANOVA with Bonferroni's post hoc test. Error bars indicate SEM. (C) The delL1rep region contains two evolutionary conserved regions (ECRs) as identified from the UCSC conservation track. ENCODE data for the enhancer-associated histone modifications H3K4me1 and H3K27ac in whole brain and olfactory bulb are also shown. The purple box denotes the deletion region; black boxes show the position of four conserved subregions that were used for luciferase assays. Image taken from UCSC Genome Browser (Kent et al. 2002). (D) koECRs 1, 2, 3, and 5 were cloned into pGL3-Promoter (Promega) in both orientations to test for enhancer activity. Constructs were transfected into E16.5 neurospheres. Graph shows the expression as measured in luminescence of luciferase relative to Renilla and normalized to the empty pGL3-Promoter vector (Prom). ECR19 was previously shown to have enhancer-like activity in ESCs and was shown to bind EP300 in brain (Visel et al. 2009). Statistics were calculated by the one-way ANOVA (and nonparametric) Friedman test to calculate the overall statistical significance (P-value), followed by Dunn's Multiple Comparison post-test to calculate the statistical significance (P-value) between specific samples. P < 0.05 was deemed as statistical significant. (Prom) pGL3-Promoter empty vector.


