
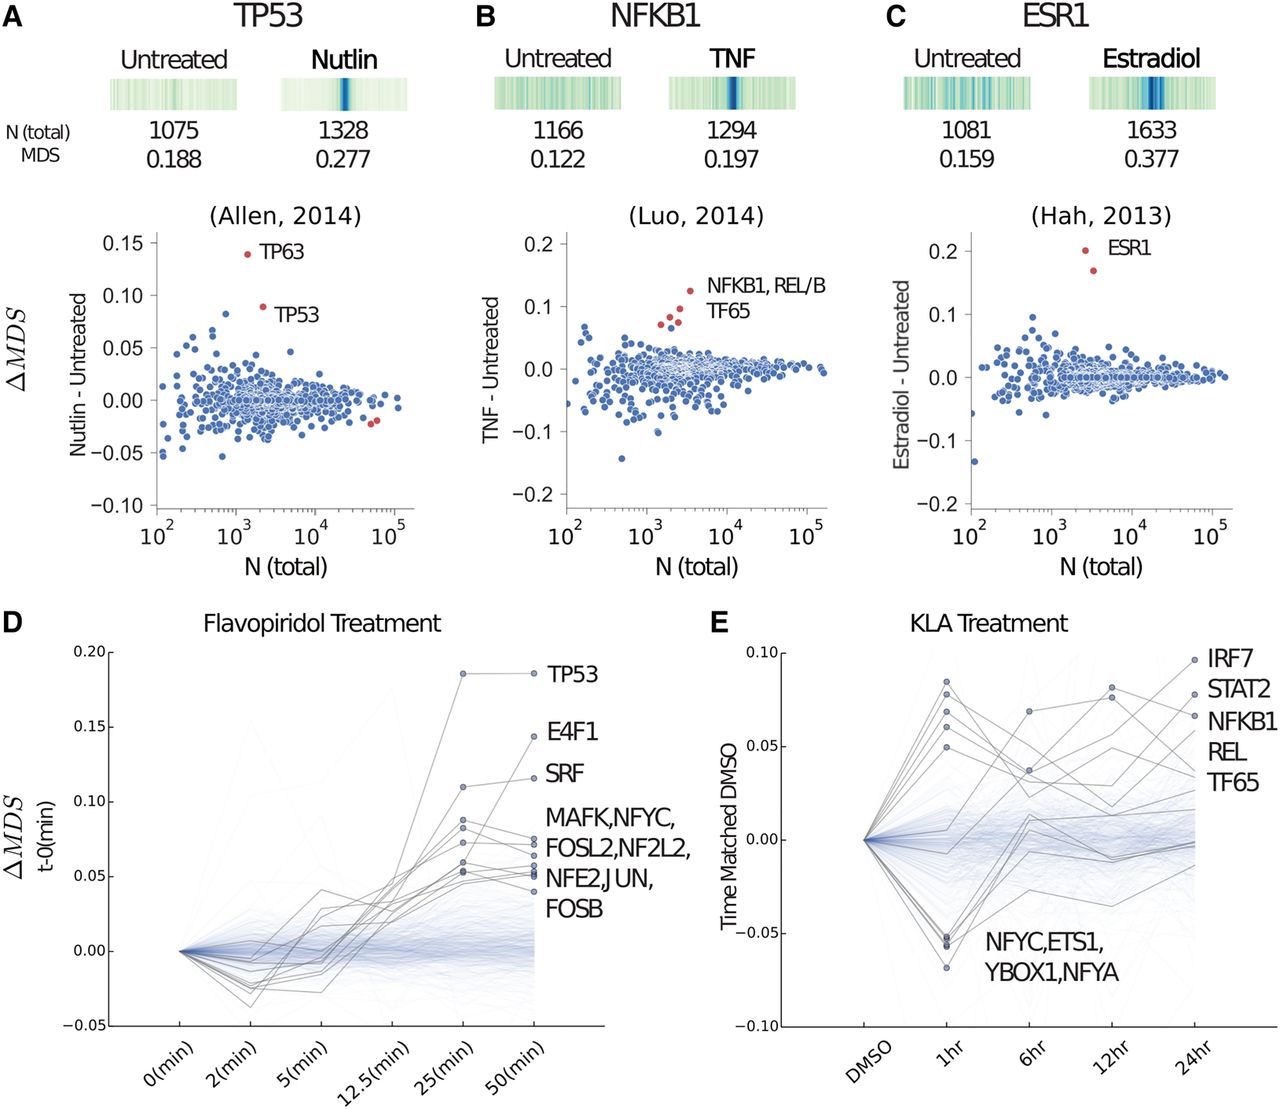
MD-scores predict TF activity. (A, top) The MD distribution, MD-score, and the number of motifs within 1.5 kb of any eRNA origin before and after stimulation with Nutlin-3a (e.g., Nutlin) on TP53 (Allen et al. 2014), the TF known to be activated. (Bottom) For all motif models (each dot), the change in MD-score (ΔM DS) following perturbation (y-axis) relative to the number of motifs within 1.5 kb of any eRNA origin (x-axis). Red points indicate significantly increased and/or decreased MD-scores, respectively (P-value <10−6). Similar analysis for TNF activation of the NF-κB complex (B) (Luo et al. 2014) and estradiol activation of estrogen receptor (ESR1; C) (Hah et al. 2013). (D) A time series data set following treatment with flavopiridol (Jonkers et al. 2014). The y-axis indicates the MD-score change relative to time point zero. Blue dots indicate a MD-score difference <10−6. A darker shaded line indicates a time trajectory with at least one significant MD-score. (E) Time series data set following treatment with Kdo2-lipid A (KLA) where each time point is normalized to time-matched DMSO (Kaikkonen et al. 2014). Therefore, the y-axis indicates MD-score difference relative to the time point–matched DMSO sample. NCBI Sequence Read Archive (SRA) SRR numbers of these comparisons are outlined in Supplemental Table S4.


