
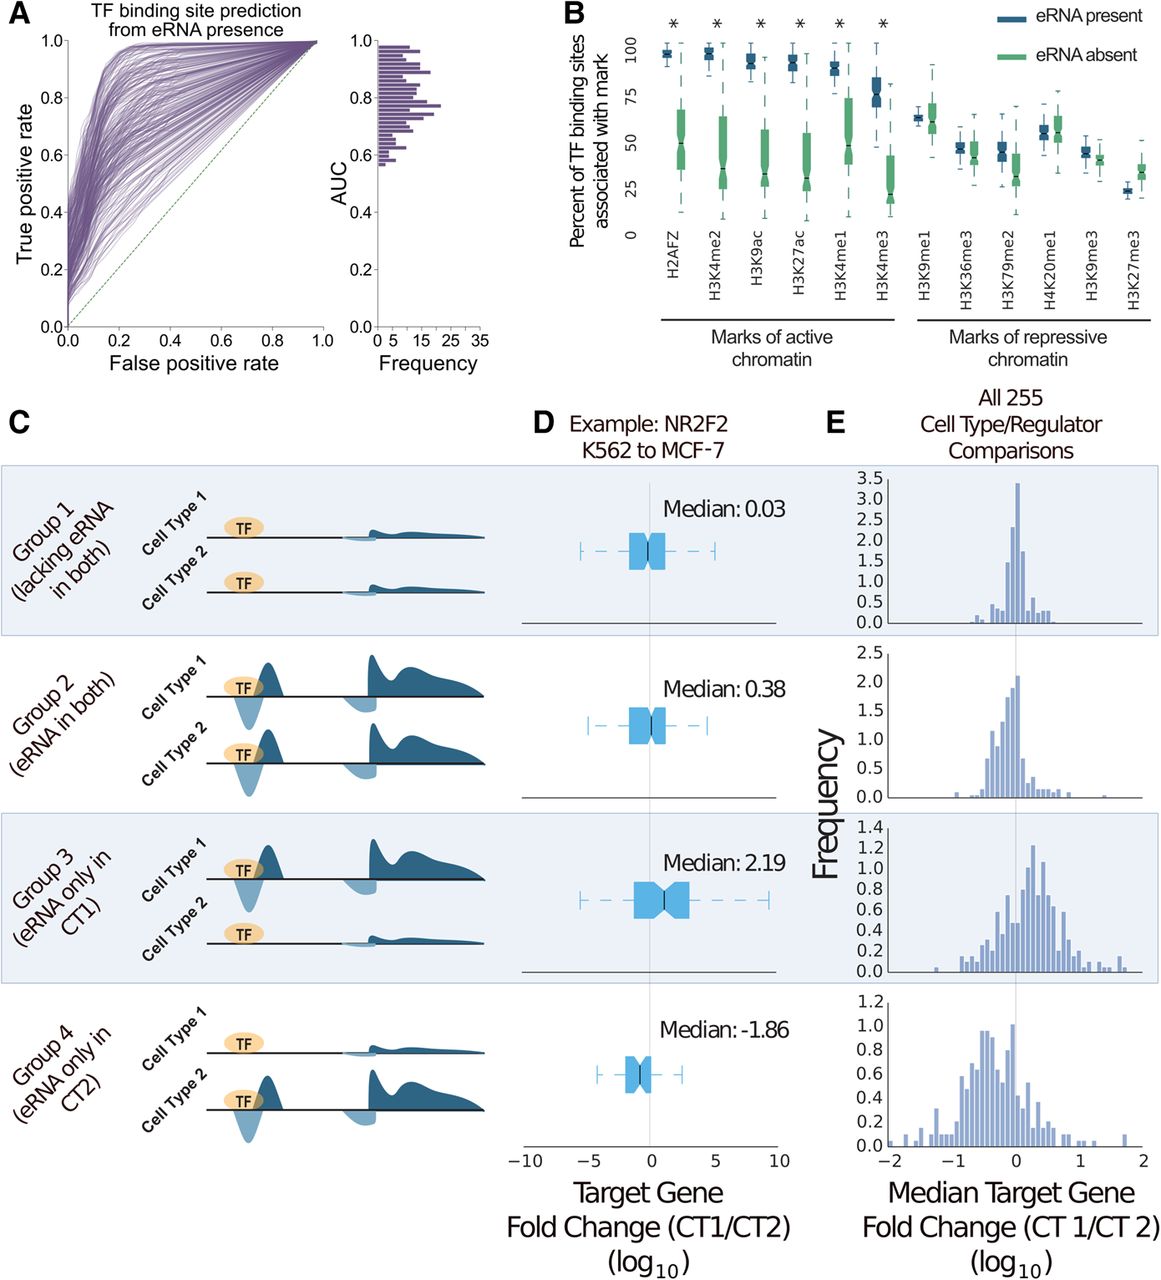
Enhancer RNA (eRNA) presence marks the active subset of TF binding. (A) ROC analysis of TF binding site prediction via eRNA presence. False-positive and true-positive rates are varied by thresholding the penalized likelihood ratio statistic generated from Tfit. (B) TF binding peaks (Supplemental Table S1) were grouped according to eRNA association. A box-and-whiskers displays the median/variability in proportion of histone mark association between the groups across all TFs (Supplemental Table S1). Asterisks indicate a P-value <10−10 by z-test. All data in A and B are K562 cells. (C) Pairwise cell type–associated TF binding peaks were grouped according to eRNA presence from matched cell types (Supplemental Table S2). A gene was considered “neighboring” by a distance <10 kb. (D) Log base 10 FPKM fold change of “neighboring” genes related to eRNA-grouped NR2F2 binding peaks. (E) Histogram of Log base 10 FPKM fold change of “neighboring” genes for all possible eRNA-grouped TF ChIP-seq data sets (n = 255).


