
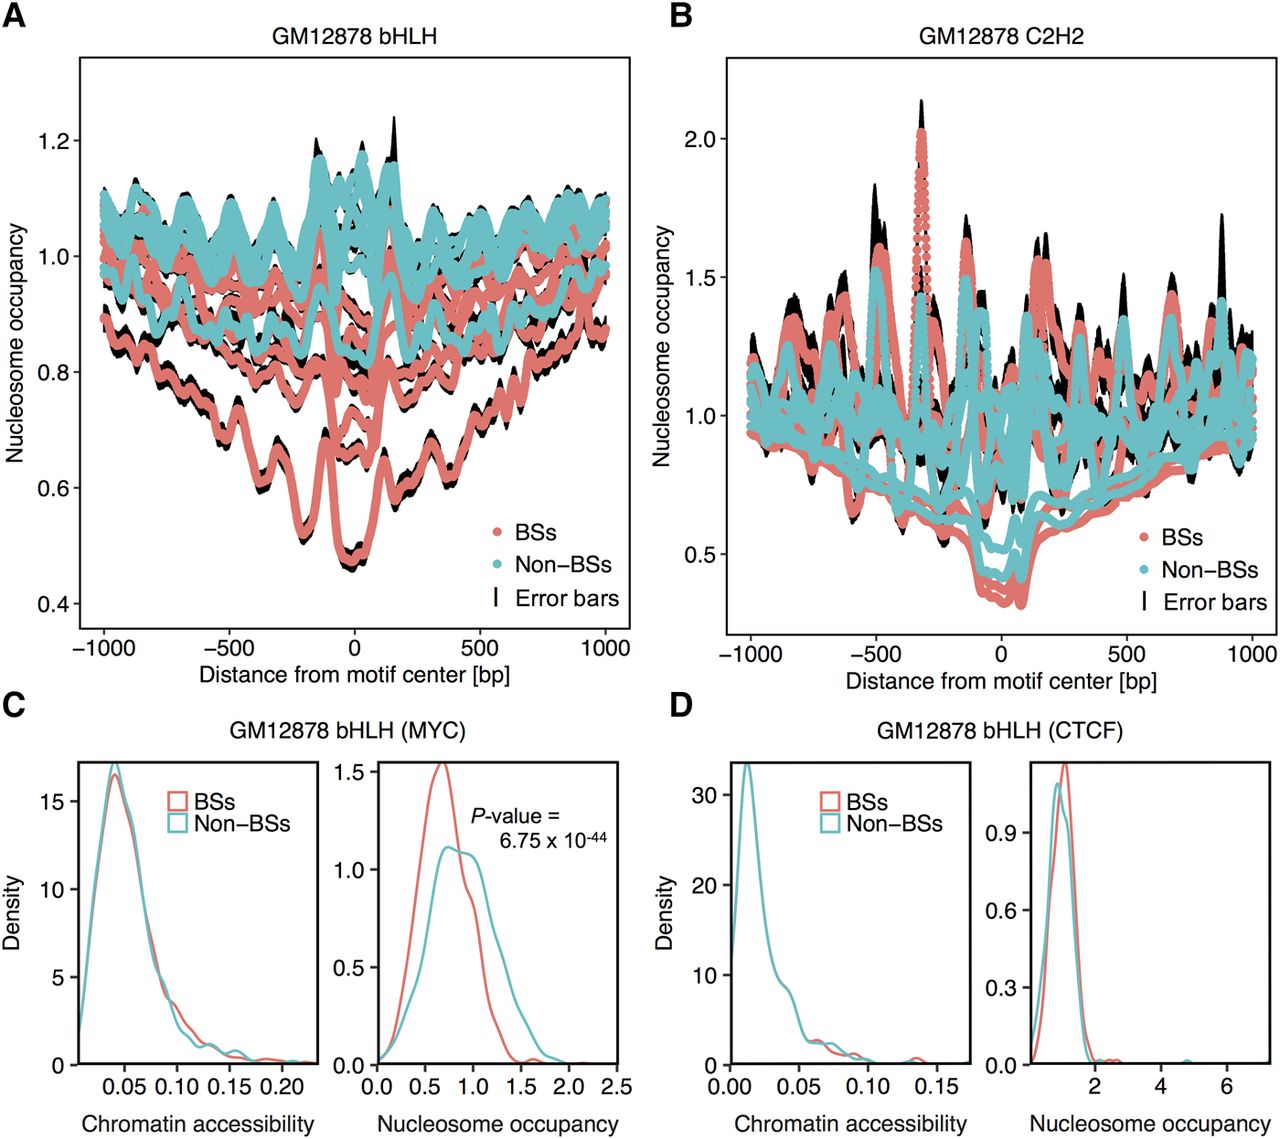
Nucleosome occupancy decreases around BSs compared to non-BSs among TF families that bind in an HM-specific manner. Average nucleosome occupancy in each position 1 kb upstream of and downstream from BSs and non-BSs for the bHLH (A) and C2H2 (B) families in the GM12878 cell line. Black edges encompassing the average line represent standard error bars at each nucleotide position. (C,D) Density plots showing distributions of chromatin accessibility and nucleosome occupancy around BSs and non-BSs for MYC in the bHLH family (C) and CTCF in the C2H2 family (D). Two-sided Wilcoxon tests were conducted to test if these distributions had shifts. Only distributions of nucleosome occupancy for MYC BSs exhibited significant shifts, as indicated by the P-value.


