
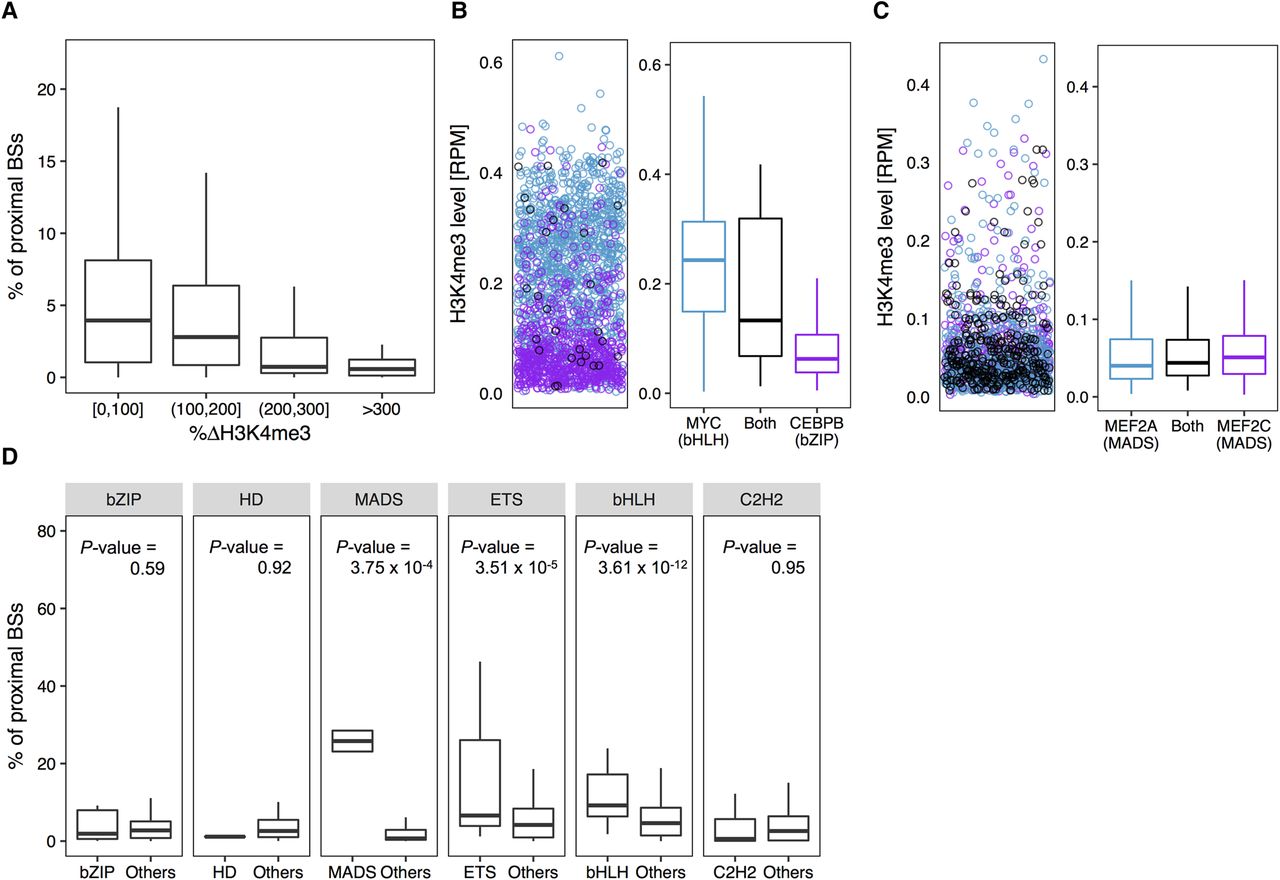
HM environment can constrain TF co-occupancy in the GM12878 cell line. TFs from the same protein family and TF families with a similarly favorable HM environment (or binding manner) tend to colocalize in the genome. (A) Box plots of percentages of BSs of a TF that are in close proximity (within 300 bp) to BSs of each of the other TFs versus average differences of H3K4me3 surrounding BSs between these two TFs. (B, left) H3K4me3 level surrounding BSs shared (black) by MYC (bHLH family) and CEBPB (bZIP family), MYC-only (blue), and CEBPB-only (purple). (B, right) Box plots representing the distribution of H3K4me3 levels surrounding BSs shared by MYC and CEBPB (black), MYC-only (blue), and CEBPB-only (purple). (C, left) H3K4me3 level surrounding BSs shared (black) by MEF2A and MEF2C (both from the MADS-domain family), MEF2A-only (blue), and MEF2C-only (purple). (C, right) Box plots representing the distribution of H3K4me3 levels surrounding BSs shared by MEF2A and MEF2C (black), MEF2A-only (blue), and MEF2C-only (purple). (D) Box plots displaying the distribution of percentages of proximal BSs among intra-family TF pairs and inter-family TF pairs for each protein family. One-sided Wilcoxon test P-values show that intra-family TF pairs have significantly higher percentages of proximal BSs compared to inter-family TF pairs.


