
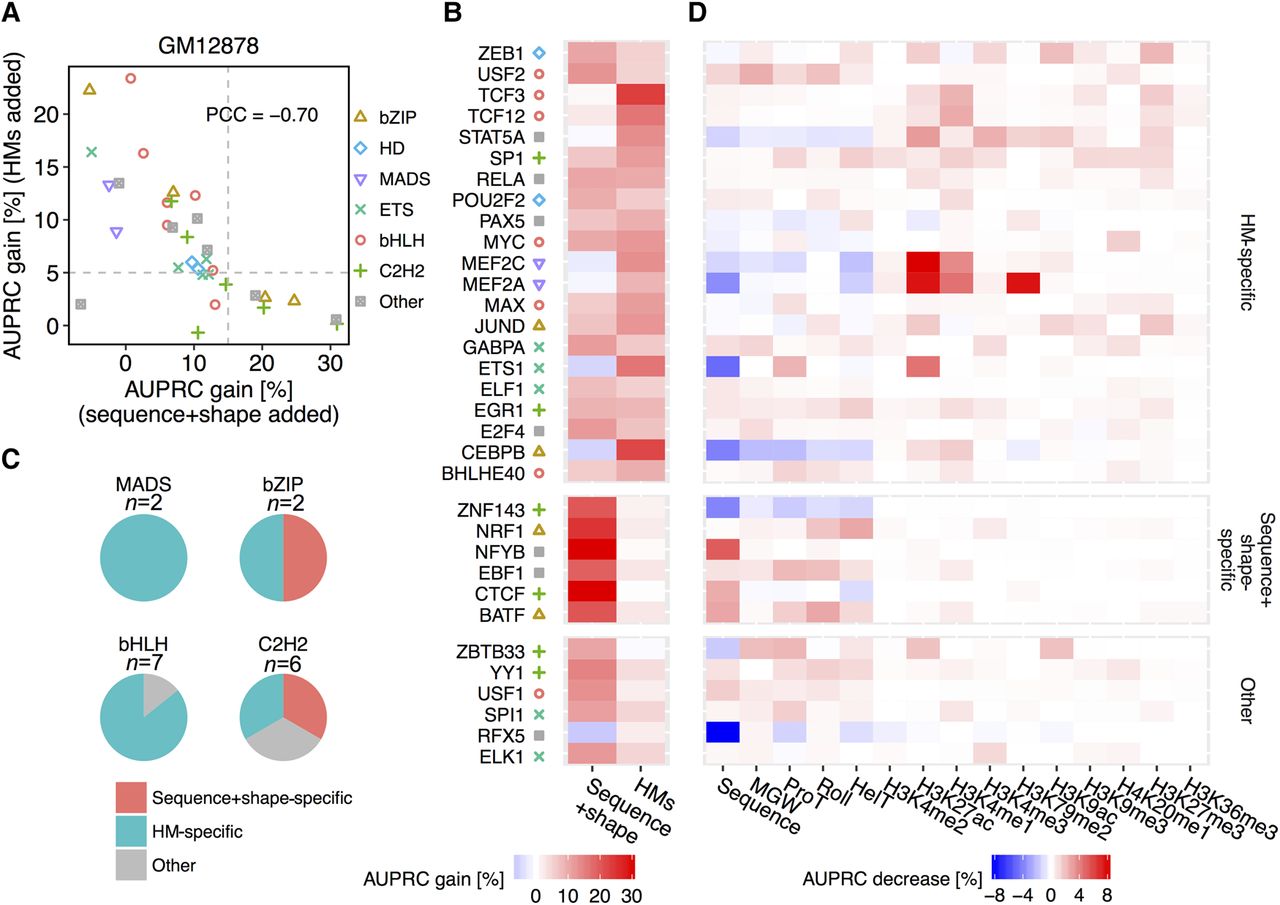
Deconvolution of DNA sequence and shape features at flanking regions and 10 HM patterns in the GM12878 cell line. (A) Scatter plot showing performance gain through adding different sets of features. The x-axis represents HM pattern-only models as baseline, and recorded performance increases through adding DNA sequence and shape features at flanking regions. The y-axis represents models based on DNA sequence and shape features at flanking regions as baseline, and recorded performance increases through adding HM pattern features. Gray dashed lines intersect with x-axis at 15% and with y-axis at 5%. The Pearson correlation coefficient (PCC) was calculated between AUPRC gain through adding these two sets of features. (B) Heat map displaying performance gains when adding either sequence+shape features or HM patterns. With cutoffs as shown by the gray dashed line in A, TFs were grouped into sequence+shape specific, HM specific, and a group with other features preferred. (C) Pie charts showing the number of TFs with different binding mechanisms in the MADS-domain, bHLH, bZIP, and C2H2 TF families. (D) Heat map representing the percentage decrease of AUPRC in leave-one-feature-out experiments compared to complete models considering DNA sequence and shape features, and 10 HM features. A more intense red color in a cell indicates a greater performance decrease when leaving out the feature displayed in the x-axis for the TF displayed in the y-axis.


