
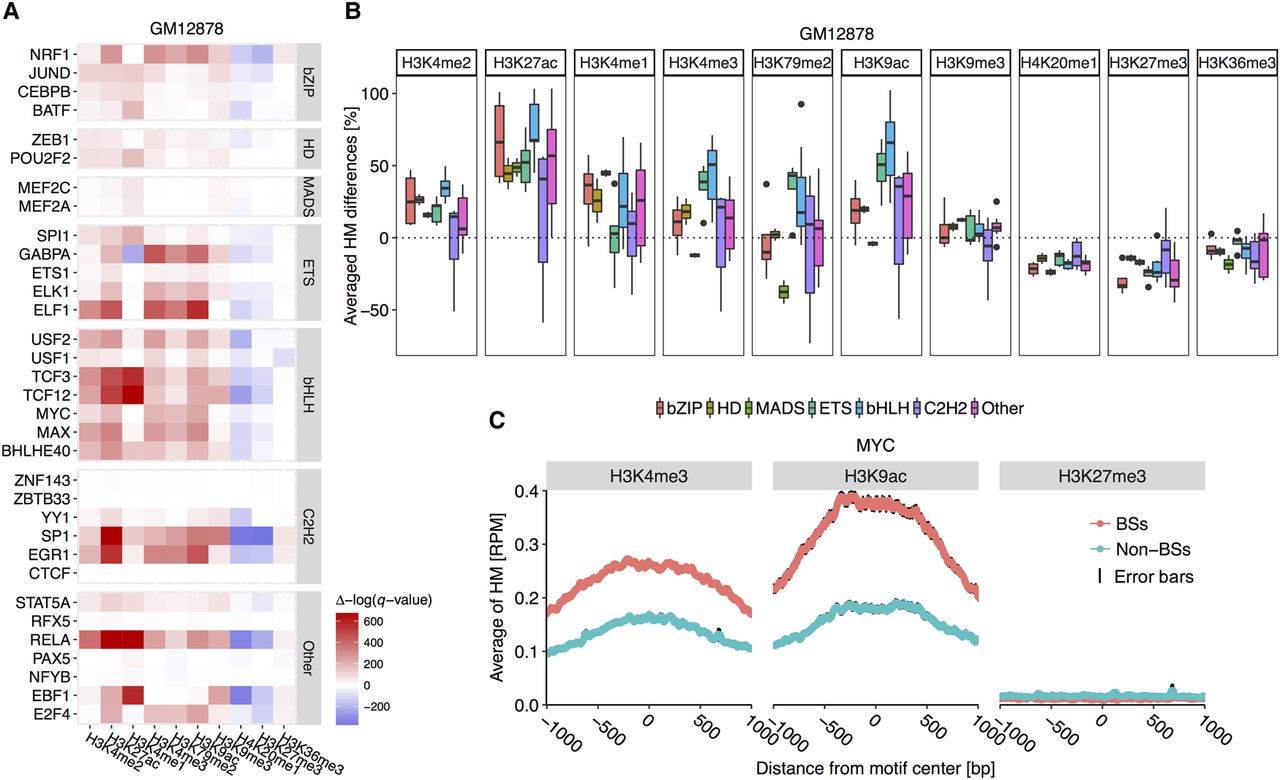
TF families show conserved differences in HM patterns between BSs and non-BSs. (A) Heat map displaying results of statistical comparison between HM levels at positions 1 kb upstream of and downstream from BSs and non-BSs in the GM12878 cell line. Positive Δ[−log(q-value)], in red, indicates BS environments with significantly higher HM levels compared to non-BS environments. Negative Δ[−log(q-value)], in blue, indicates BS environments with lower HM levels. The MADS-domain, C2H2, ETS, and bHLH TF families show conserved HM pattern differences. (B) Average HM differences across TF families in the GM12878 cell line. Centerlines of box plots represent medians, edges indicate the first and third quartiles, and whiskers indicate minimum/maximum values within 1.5 times the interquartile from the box. This setup for displaying box plots is consistent in subsequent box plots. (C) Average H3K4me3, H3K9ac, and H3K27me3 levels at each position 1 kb upstream of and downstream from BSs and non-BSs for MYC (bHLH family). Black edges encompassing the average line represent standard error bars at each nucleotide position.


