
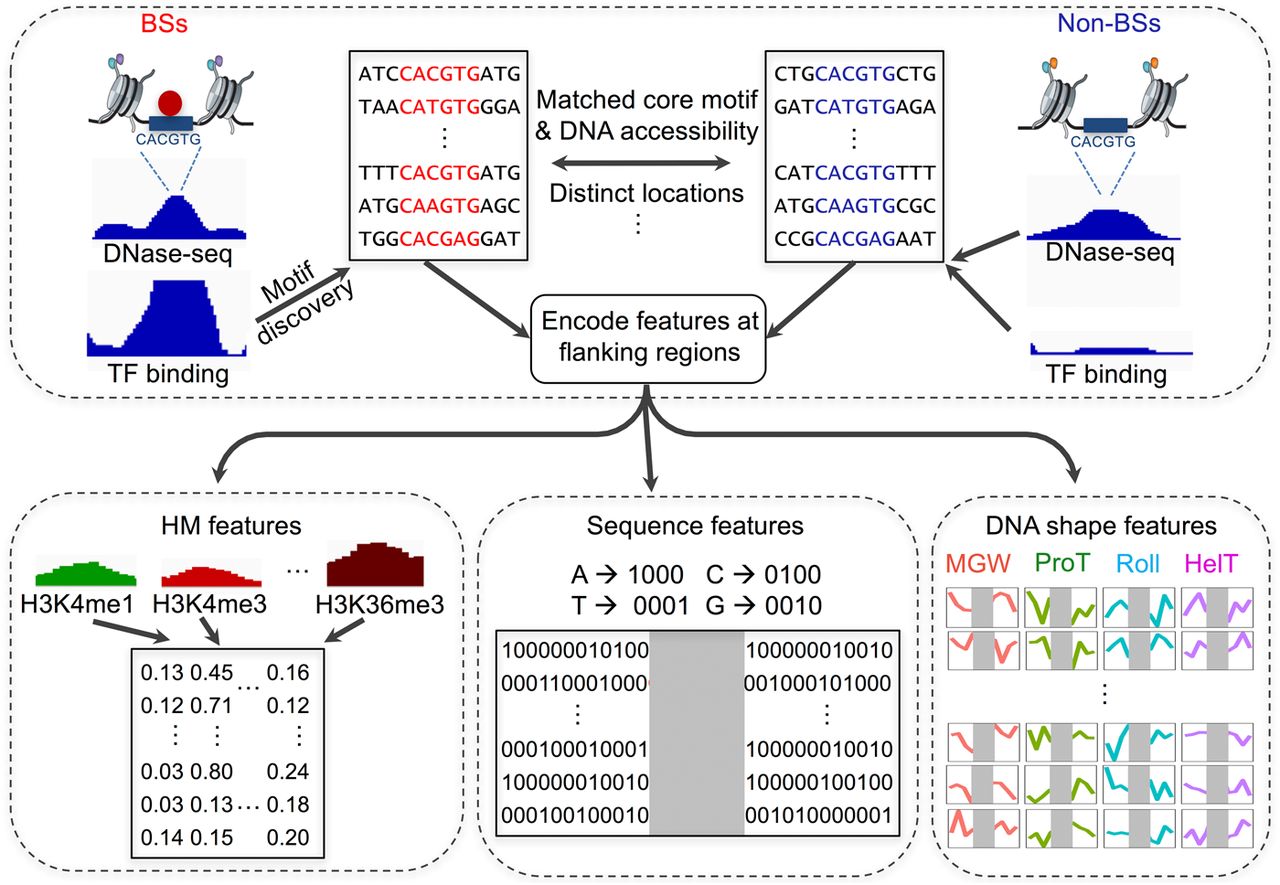
Flowchart describing the approach of modeling BSs and non-BSs with DNA sequence, DNA shape features at flanking regions, and HM features. In each cell line, chromatin-accessible regions derived from DNase-seq data were genomic regions of interest. For each TF, sequences at ChIP-seq peaks were first aligned using position frequency matrices (PFMs) to obtain BSs. For each BS, an exactly matched motif was found from chromatin-accessible and distinct genomic regions as a motif pool. Within the motif pool, motif sets with similar chromatin accessibility distributions as the BSs were selected as non-BSs. With a set of BSs and non-BSs, DNA sequence and four DNA shape features, as well as 10 HM patterns, were calculated for flanking regions and fed to downstream modeling to distinguish BSs and non-BSs.


