
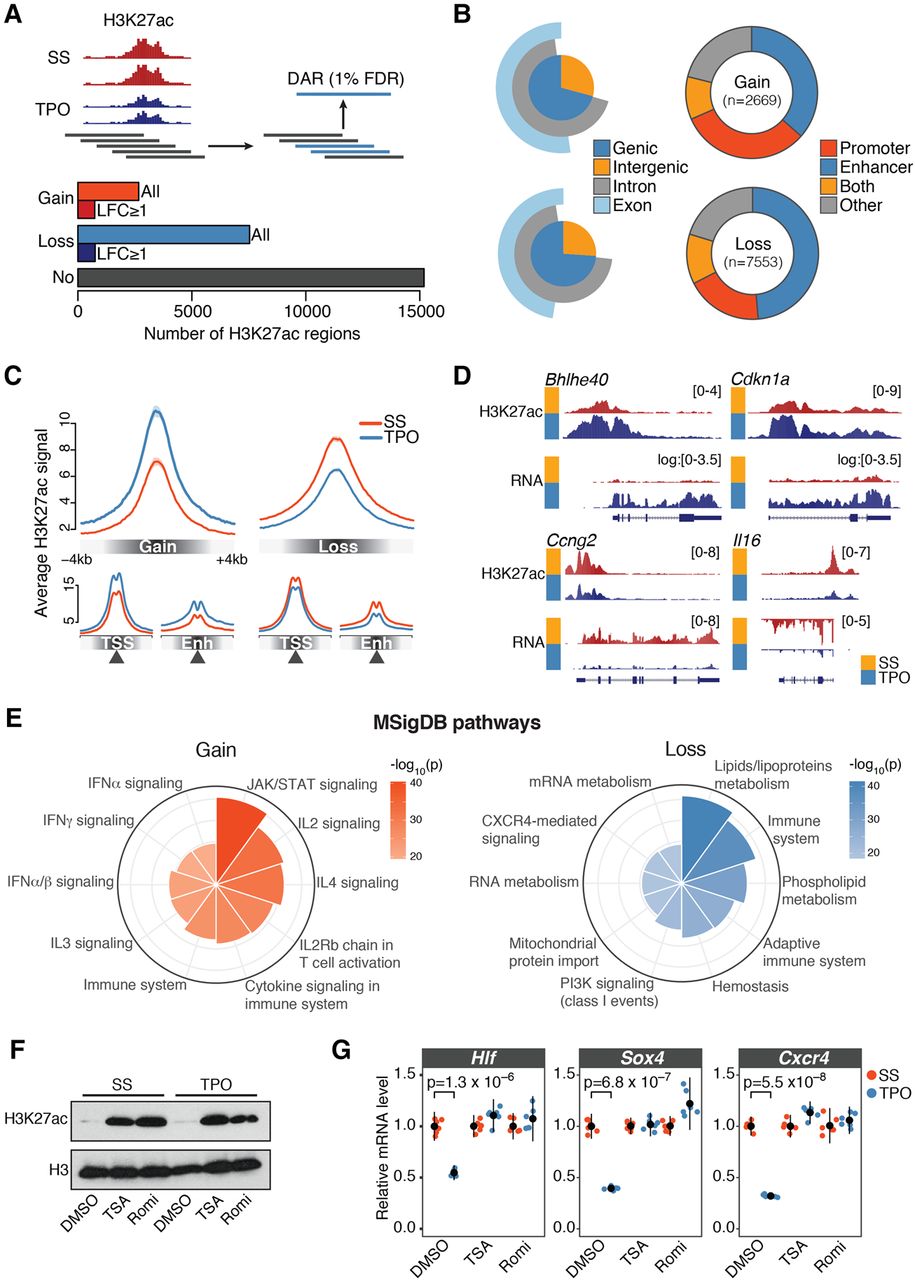
TPO signaling elicits rapid and extensive epigenome remodeling at cis-regulatory elements. (A, top) Schematic representation of the tiling-window approach used to identify differentially acetylated regions (DARs) from H3K27ac ChIP-seq profiles. Significant overlapping windows (blue rectangles) were merged to call DARs at 1% false discovery rate (FDR). (Bottom) Total number of activated (Gain) and repressed (Loss) DARs. H3K27ac regions not significantly altered by 30 min TPO (No) are also shown. (LFC) log2 fold change. (B, left) Annotation of DARs with respect to genomic compartments. (Right) Annotation of DARs with respect to cis-regulatory elements inferred from DNase-seq profiles in serum-starved HPC-7 cells (Methods). (C) Average normalized H3K27ac signal within ±4 kb of DAR summits (top), transcription start sites (TSSs), or enhancer summits (Enh). (D) Representative tracks of DARs. Where indicated, chromatin-associated RNA-seq coverage was log transformed with a pseudocount of 1. (E) Genomic regions enrichment of annotations tool (GREAT) analysis of DARs. Top 10 significantly enriched Molecular Signature Database (MSigDB) pathways for gene associated with DARs, ranked by binomial P-value. (F) Western blot analysis of H3K27ac and total H3 levels in HPC-7 cells pretreated for 30 min with DMSO, Trichostatin A (TSA), or Romidepsin (Romi), before and after 30 min TPO stimulation. (G) Corresponding mRNA expression levels of the indicated genes relative to serum-starved (SS) control cells, measured by quantitative RT-PCR. Error bars are mean ± SD (n = 6) from two biological replicates. P-values are from a two-sided Welch's t-test.


