
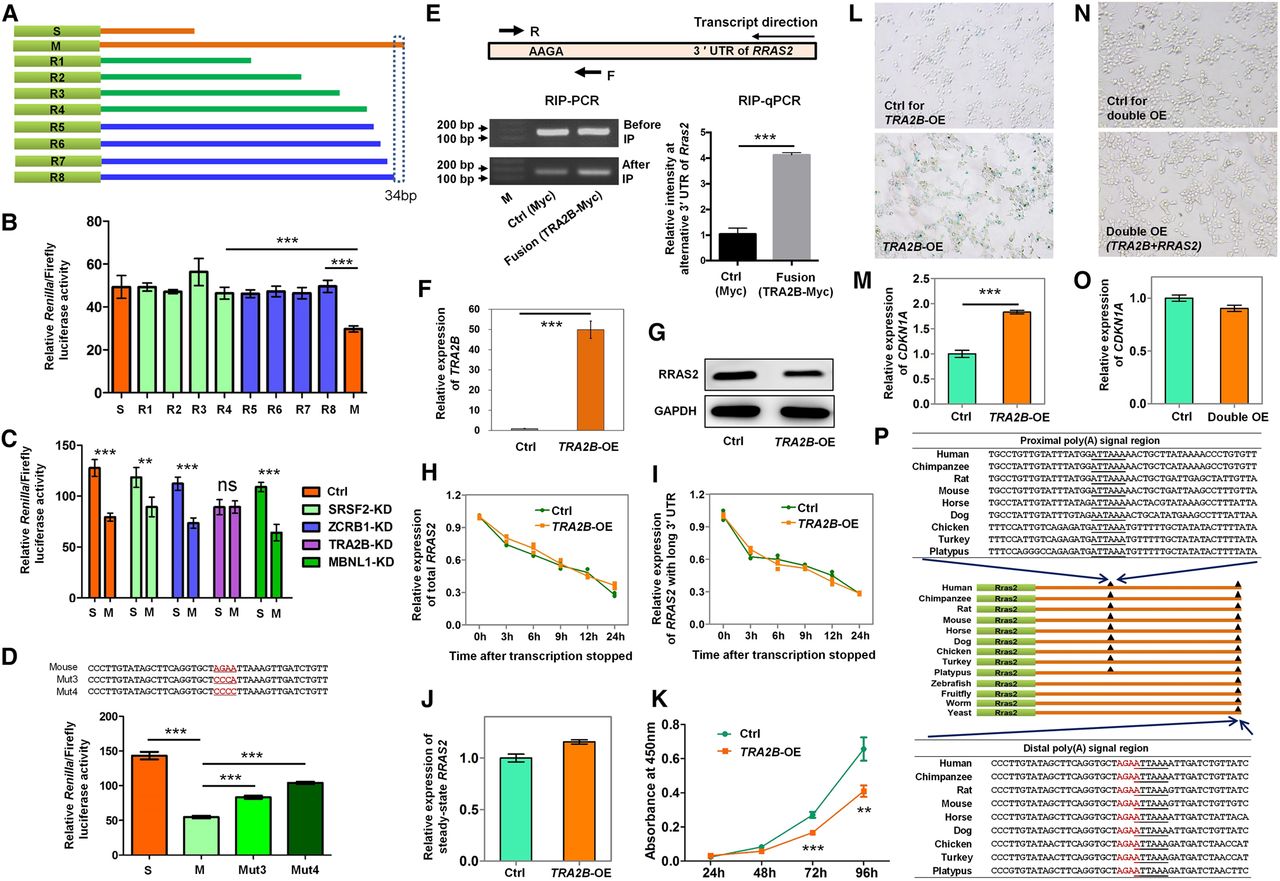
Binding of TRA2B to the alternative 3′ UTR of Rras2 causes cellular senescence via reduced RRAS2 expression. (A) Schematic diagram of the truncation strategy to identify key cis regulatory elements. M denotes full length 3′ UTR with mutated proximal poly(A) signal. S represents 3′ UTR using the proximal pA site. R1–R4 refer to four truncated 3′ UTR fragments constructed for the first round screen. R5–R8 denote four additional constructs for the second-round screen. (B) Luciferase assays for all constructs indicated in A. (C) Luciferase assay screen for key trans-acting factors in candidate RBP knockdown cells. (ns) Not significant. (D) Luciferase assay in mouse cells transfected with constructs containing mutations introduced in the potential region containing the key cis-element. “AGAA” is the core binding motif of TRA2B (Grellscheid et al. 2011). (E) TRA2B binding to the alternative 3′ UTR of Rras2 evaluated by RIP-PCR and RIP-qPCR. The PCR primer pair (F and R, forward and reverse, respectively) was designed to span the “AGAA” motif. TRA2B was fused to Myc protein to serve as the ectopically expressed fusion protein. A vector expressing Myc protein served as the internal control (Ctrl). Anti-Myc was used to pull down RNA from MEF cells either expressing Ctrl (Myc) or Fusion (TRA2B-Myc) protein. The same amount of RNA was applied for RIP-PCR (left panel) and RIP-qPCR (right panel). (F) qRT-PCR validation of TRA2B overexpression (TRA2B-OE) in human 293T cells. (G) Decreased RRAS2 protein level upon TRA2B overexpression detected by Western blot in 293T cells. (H,I) RRAS2 RNA degradation rate was assayed for total isoforms (H) and isoform with longer 3′ UTRs (I) in TRA2B-OE and control human cells by qRT-PCR. (J) Steady-state mRNA level of RRAS2 was quantified in TRA2B-OE and control human cells by qRT-PCR. (K) Overexpression of TRA2B slows down cell proliferation as detected by the CCK-8 assay. (L,M) TRA2B-OE caused increased SA-β-gal staining (L) and CDKN1A expression (M) in 293T cells. (N,O) Overexpression of RRAS2 in TRA2B up-regulated human cells reversed SA-β-gal staining (N) and CDKN1A expression (O). (P) Sequence alignment near proximal and distal pA sites of Rras2 in representative species. The PAS is underlined while the TRA2B core binding motif “AGAA” is highlighted in red text. (***) P < 0.001, (**) P < 0.01, two-tailed t-test.


