
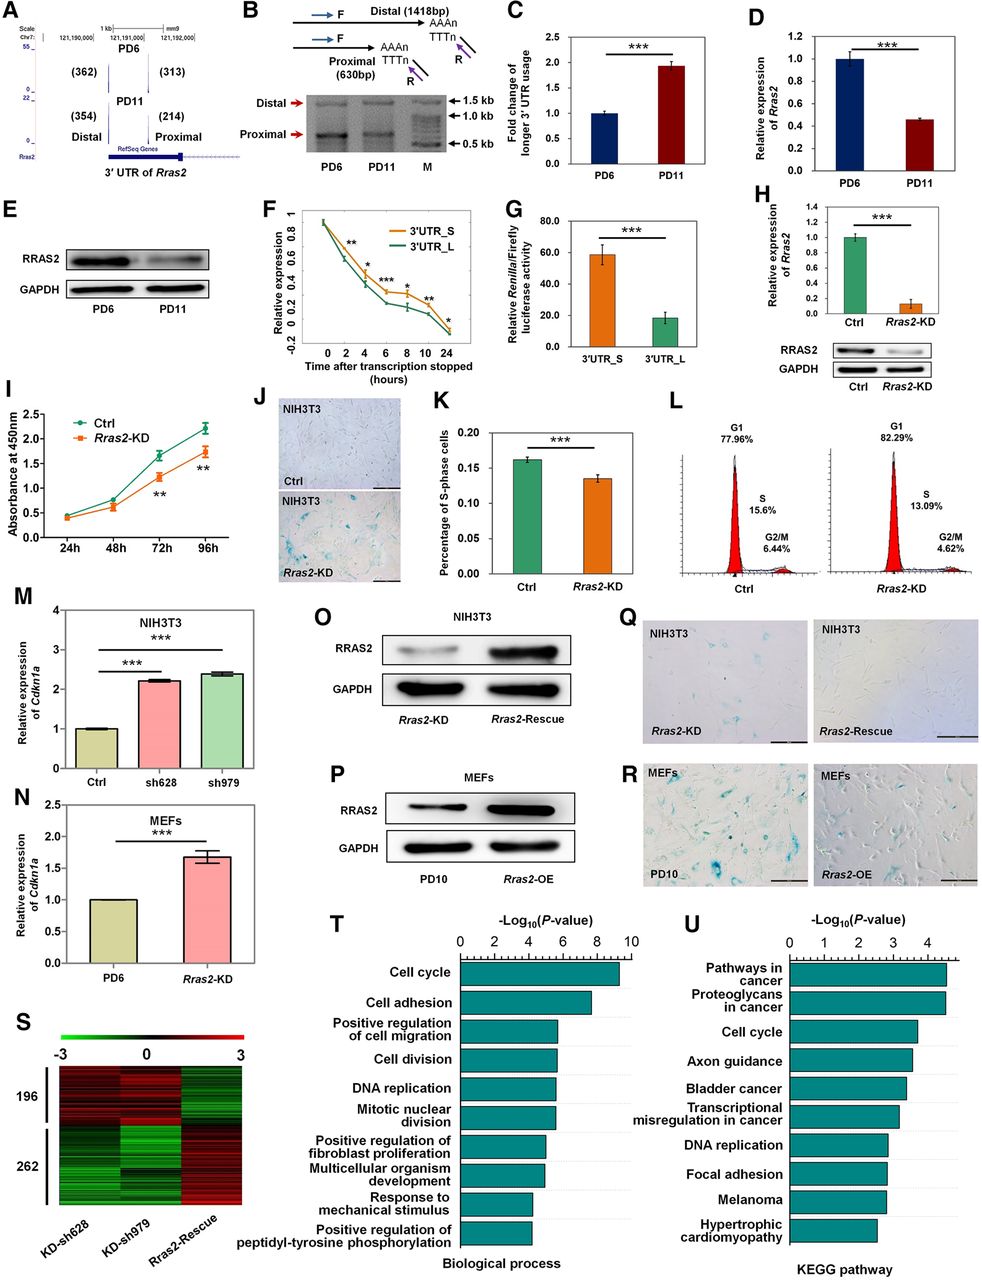
Down-regulation of Rras2 through 3′ UTR lengthening promotes cellular senescence in mouse cells. (A) PA-seq track of proximal and distal pA site usage in PD6 and PD11 MEFs. Raw tag numbers reflected by both width and height of each pA peak are indicated in parentheses. (B) Changes of distal and proximal pA site usage between PD6 and PD11 MEF cells detected by 3′ RACE. The 3′ RACE strategy is shown in the upper panel. F and R indicate forward and reverse primers, respectively. PCR product sizes for distal and proximal pA sites are shown in parentheses. (C) The Rras2 gene has increased usage of the distal pA site in MEF PD11 compared to PD6 detected by qRT-PCR. (D,E) qRT-PCR (D) and Western blot (E) of Rras2 expression in PD6 and PD11 MEFs. Gapdh serves as the internal control. (F) Stability comparison of Rras2 isoforms with 3′ UTR_S and 3′ UTR_L in mouse fibroblast cell line NIH3T3. (G) Luciferase activity from a reporter system containing 3′ UTR_S or 3′ UTR_L. (H) qRT-PCR (upper panel) and Western blot (lower panel) validation of Rras2 knockdown in NIH3T3 cells. (I) Proliferation rate evaluation of NIH3T3 cells without (Ctrl) and with Rras2 knockdown (Rras2-KD, sh979) by Cell Counting Kit-8 (CCK-8). (J) SA-β-gal staining in NIH3T3 cells without (Ctrl) and with Rras2 knockdown (Rras2-KD). (K) FACS analysis of four replicate samples showed a lower percentage of Rras2-KD NIH3T3 cells in S phase compared with control cells. (L) Percentage of cells in S, G1, and G2/M phase in one replicate. (M,N) Rras2 depletion promoted Cdkn1a expression in mouse NIH3T3 cells (M) and MEFs (N) evaluated by qRT-PCR. (O,P) Western blot validations of Rras2 rescue in Rras2-KD NIH3T3 cells (O) and Rras2-overexpression (OE) in senescent MEFs (P). GAPDH serves as the internal control. (Q) Higher SA-β-gal staining caused by reduced Rras2 expression was rescued by overexpression of Rras2 (Rras2-OE) in mouse NIH3T3 cells. (R) Rras2-OE reversed senescence in primary MEF cells as evaluated by SA-β-gal staining assay. (S) Heat map of log2-transformed expression ratio of differentially expressed genes shared by Rras2-KD and Rras2-Rescue cells compared with the control NIH3T3 cells. Red and green denotes increased and decreased expression, respectively. The numbers of down- and up-regulated genes are shown on the left. (T,U) Enrichment of all differentially expressed genes shown in S for biological process (T) and the KEGG pathway (U), as determined by DAVID. (***) P < 0.001, (**) P < 0.01, (*) P < 0.05, two-tailed t-test.


