
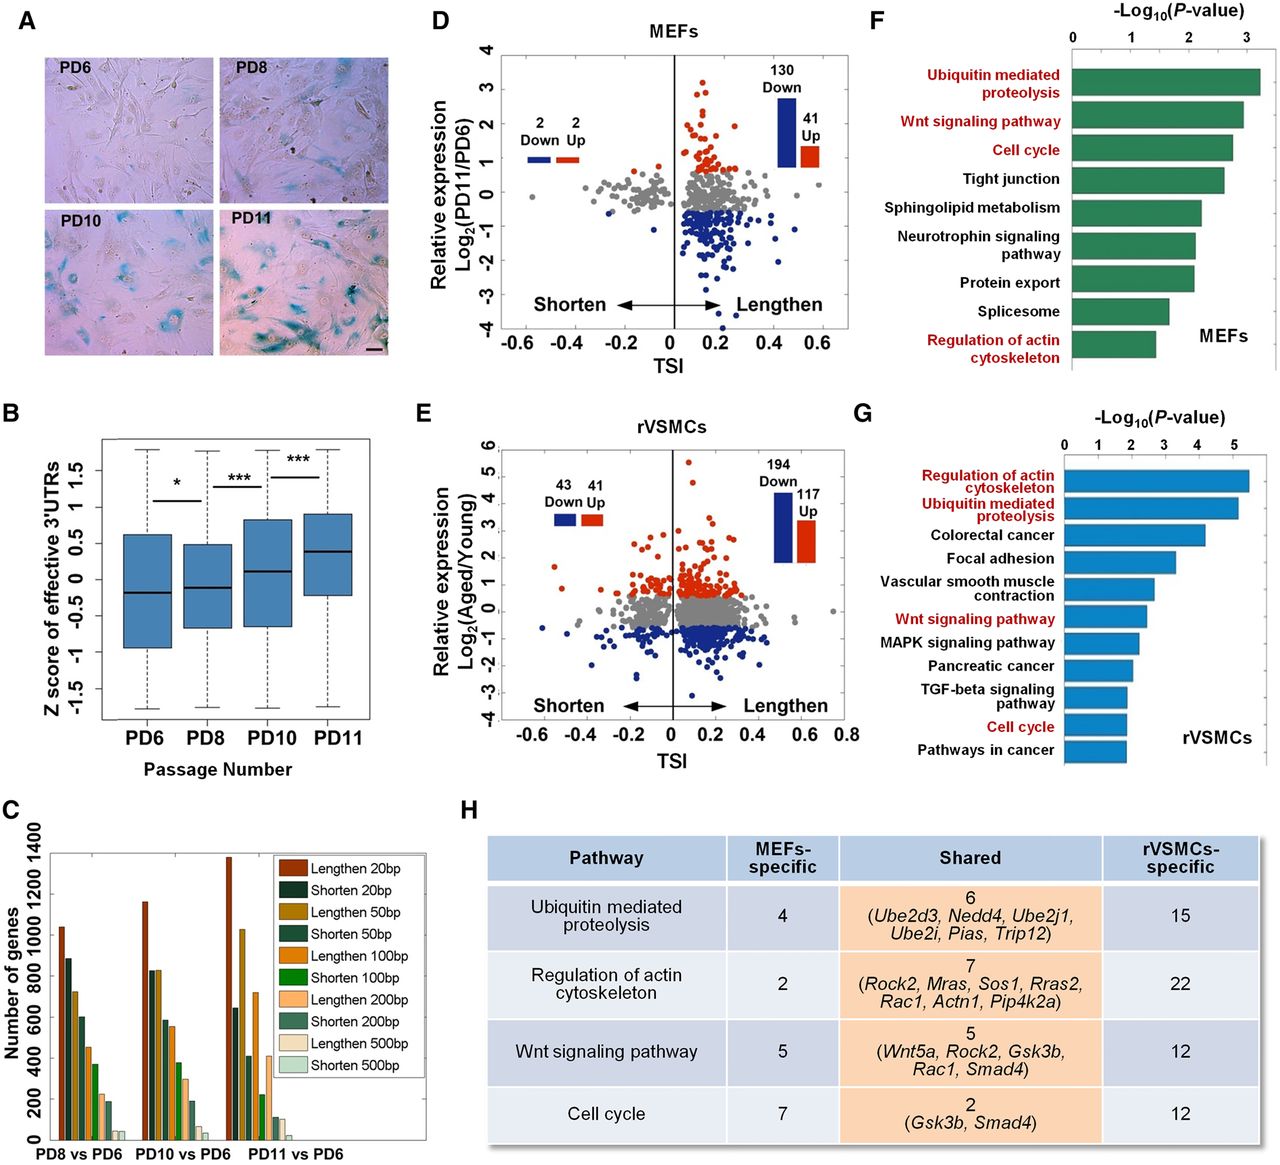
Global lengthening of 3′ UTRs in senescent cells. (A) SA-β-gal staining for MEFs of PD6, PD8, PD10, and PD11 passages. (B) Box plot for Z-score transformed effective 3′ UTRs across PD6, PD8, PD10, and PD11 MEFs. (C) Number of genes with lengthened and shortened effective 3′ UTRs. (D) Scatter plot between TSI and expression changes for genes with significantly longer or shorter 3′ UTRs in senescent MEFs (PD11 vs. PD6). TSI denotes tandem UTR isoform switch index (see Methods). The red and blue histograms represent up- and down-regulation (1.5-fold) in senescent cells, respectively. (E) Scatter plot between TSI and expression changes for genes with significantly longer or shorter 3′ UTRs in rVSMCs (old vs. young), similar to that in D. (F,G) Pathways significantly enriched (P < 0.01, Fisher's exact test) for genes tended to use distal pA sites (TSI > 0 in D and E) in senescent MEFs (F) and VSMCs derived from old rats (G). The shared senescence-related pathways are marked in red text. (H) Overlap of genes in the shared pathways between senescent MEFs and rat VSMCs. The number of genes is shown in each grid and shared gene names are in brackets.


