
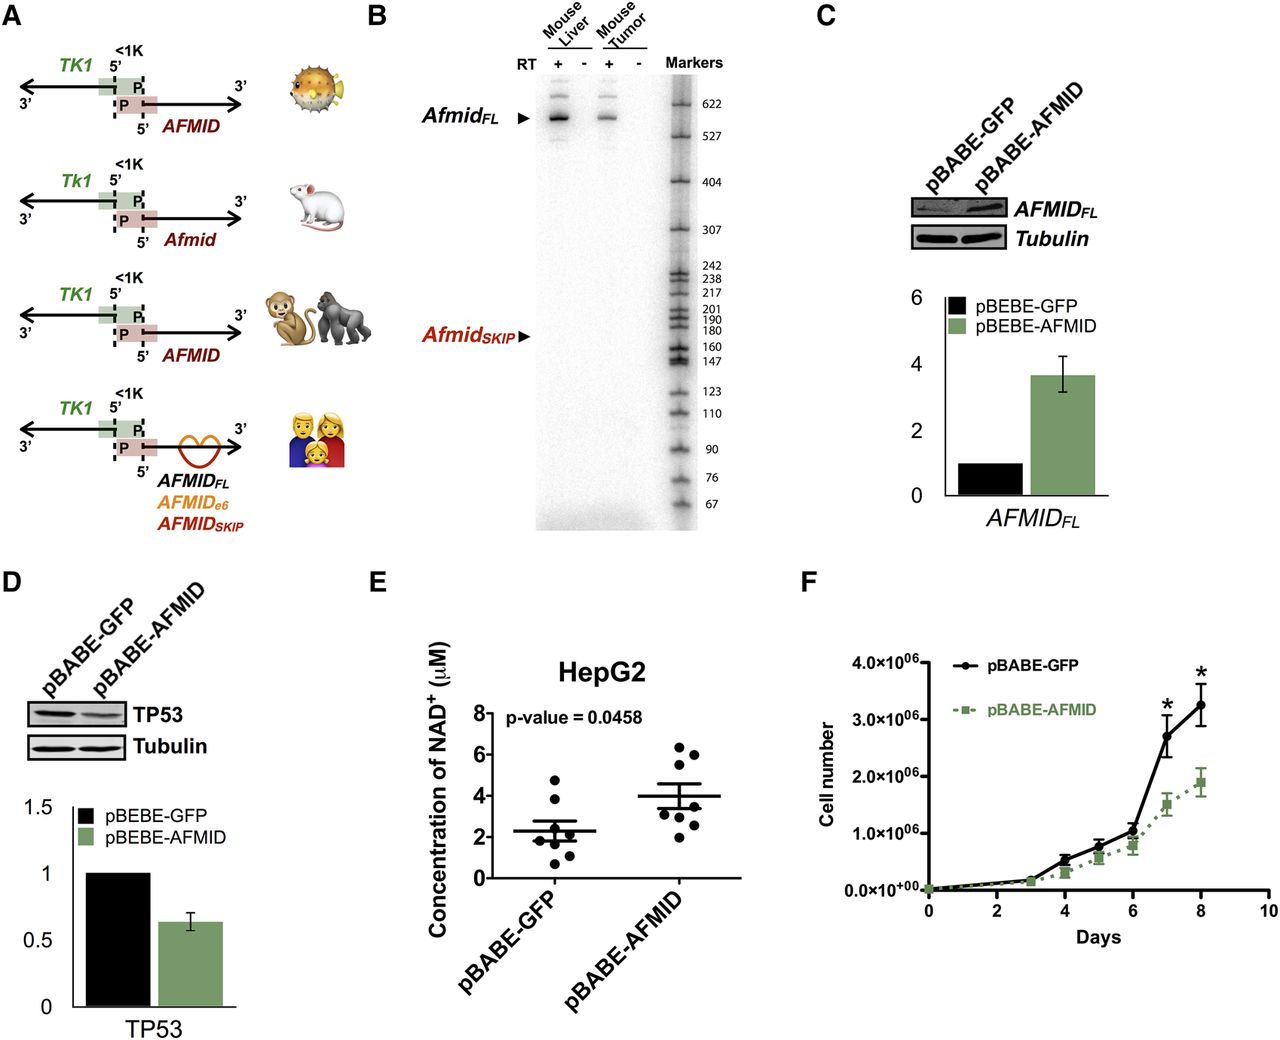
Phylogenetic comparisons of AFMID splicing patterns and functional experiments of the AFMIDFL isoform. (A) The bidirectional gene pair, TK1 and AFMID, is a conserved structure in Fugu, mouse, monkey, gorilla, and human (from top to bottom). The black arrows indicate the direction of transcription for each gene. The promoter region is indicated by green and red bars for TK1 and AFMID, respectively. The distance between the two transcription start sites is <1 kb. In the human diagram, the red arc indicates the AFMIDSKIP isoform, and the orange arcs represent the AFMIDe6 isoform. (B) Radioactive RT-PCR analysis of Afmid isoforms in mouse liver and tumor samples. Expected sizes of isoforms are labeled on the left. Size markers are shown on the right. (C,D) Representative Western blots at the top show (C) AFMIDFL and (D) TP53 levels in HepG2 cells, respectively. HepG2 cells with a GFP plasmid are labeled pBABE-GFP, and HepG2 cells with an AFMIDFL plasmid are labeled pBABE-AFMID. The bar charts below show the quantifications of Western blots from triplicate experiments. (E) The plot shows the NAD+ levels in HepG2 cells with pBABE-GFP or pBABE-AFMID from eight biological replicates. (F) Cell growth curves of HepG2 cells with pBABE-GFP (black) or pBABE-AFMID (green) are shown. Error bars indicate SEM. (*) P < 0.05.


