
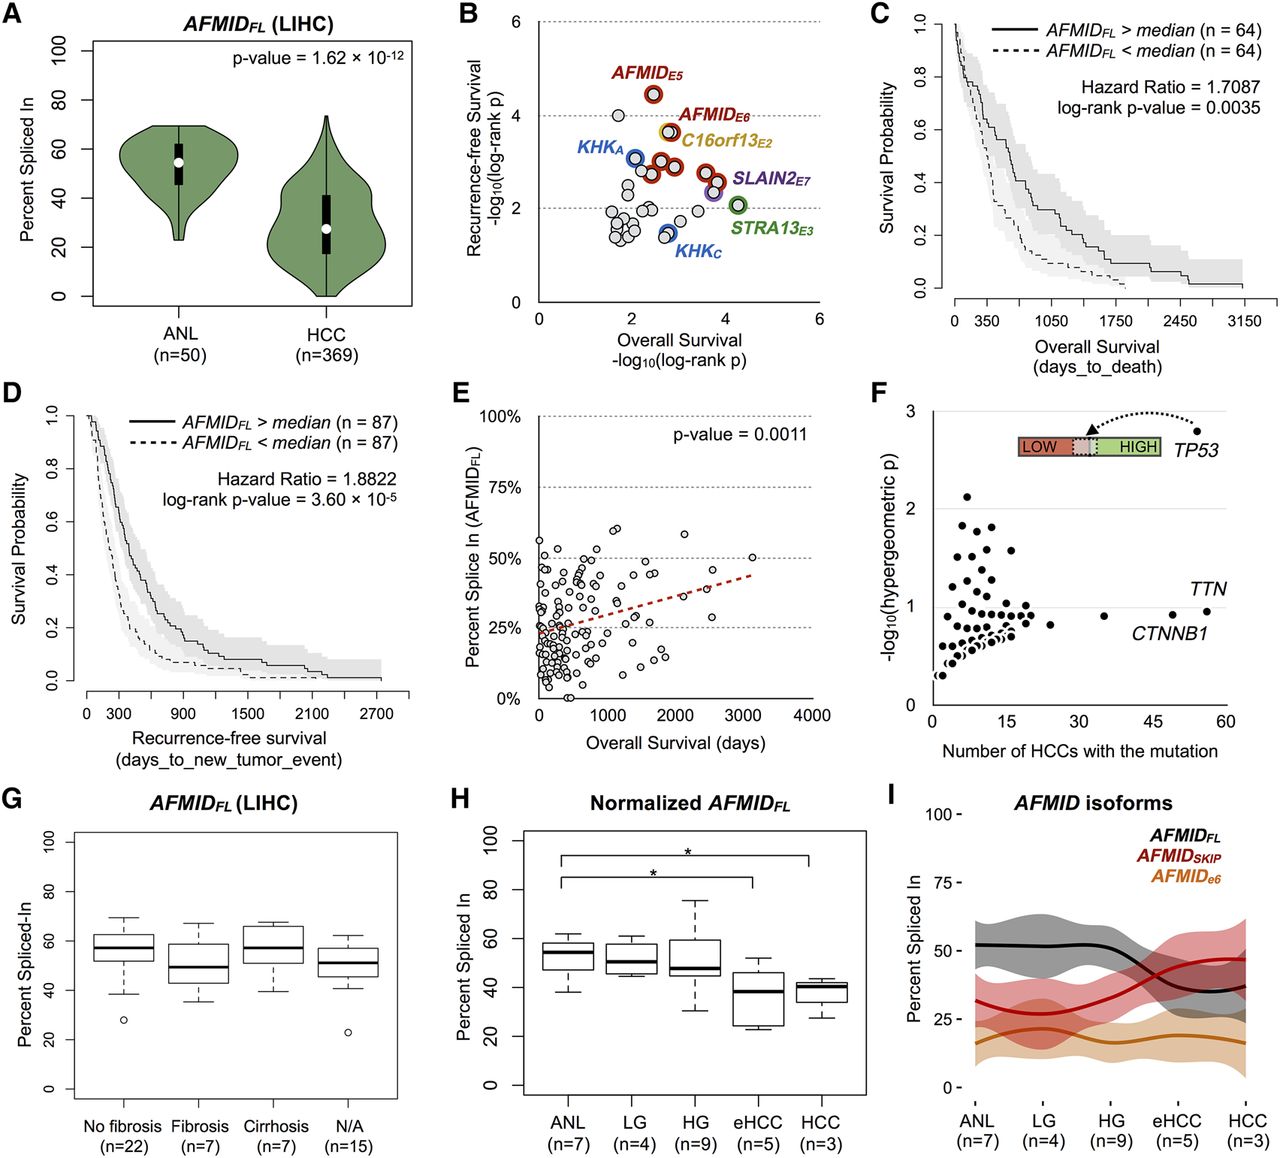
The switch of AFMID isoforms is associated with patient outcome and is already evident in early-stage HCC. (A) The vioplot shows the PSI distribution of AFMIDFL isoform in adjacent normal livers (ANLs) and HCCs in the LIHC data set of TCGA. (B) The dot plot summarizes the log-rank P-values of each alternative exon from overall (x-axis) and recurrence-free (y-axis) survival analysis, based on the LIHC data set of TCGA. Each circle represents one alternative exon. Alternative exons from the same gene are labeled with the same color. (C,D) The plots show the survival curves of AFMID-high and AFMID-low patients, based on the PSIs of the AFMIDFL isoform in overall and recurrence-free survival analysis, respectively. The PSI of the AFMIDFL isoform was determined by using the PSI of exon 5. (E) The dot plot shows the correlation between the PSI of the AFMIDFL isoform and overall survival days. (F) The plot shows the enrichment (y-axis) of mutated genes in high-AFMIDFL or low-AFMIDFL HCCs, based on the LIHC data set of TCGA. The x-axis shows the number of HCCs carrying the mutated gene. Each dot represents one gene mutated in at least one of the HCC samples. The bar labeled TP53 demonstrates that there are more TP53-mutated HCCs (light gray bar) in low-AFMIDFL HCCs (red bar). (G) The box plots show the PSIs of the AFMIDFL isoform in ANLs from patients with no fibrosis, fibrosis, or cirrhosis, in the LIHC data set. N/A means that the annotation of the liver sample was not available. (H) The box plot shows the PSI distribution of the AFMIDFL isoform in ANLs, low-/high-grade dysplastic lesions (LG/HG), early HCCs (eHCC), and HCCs. (I) The plot shows the PSI patterns of AFMIDFL(black), AFMIDSKIP(red), and AFMIDe6 (orange) isoforms in different groups of liver samples.


