
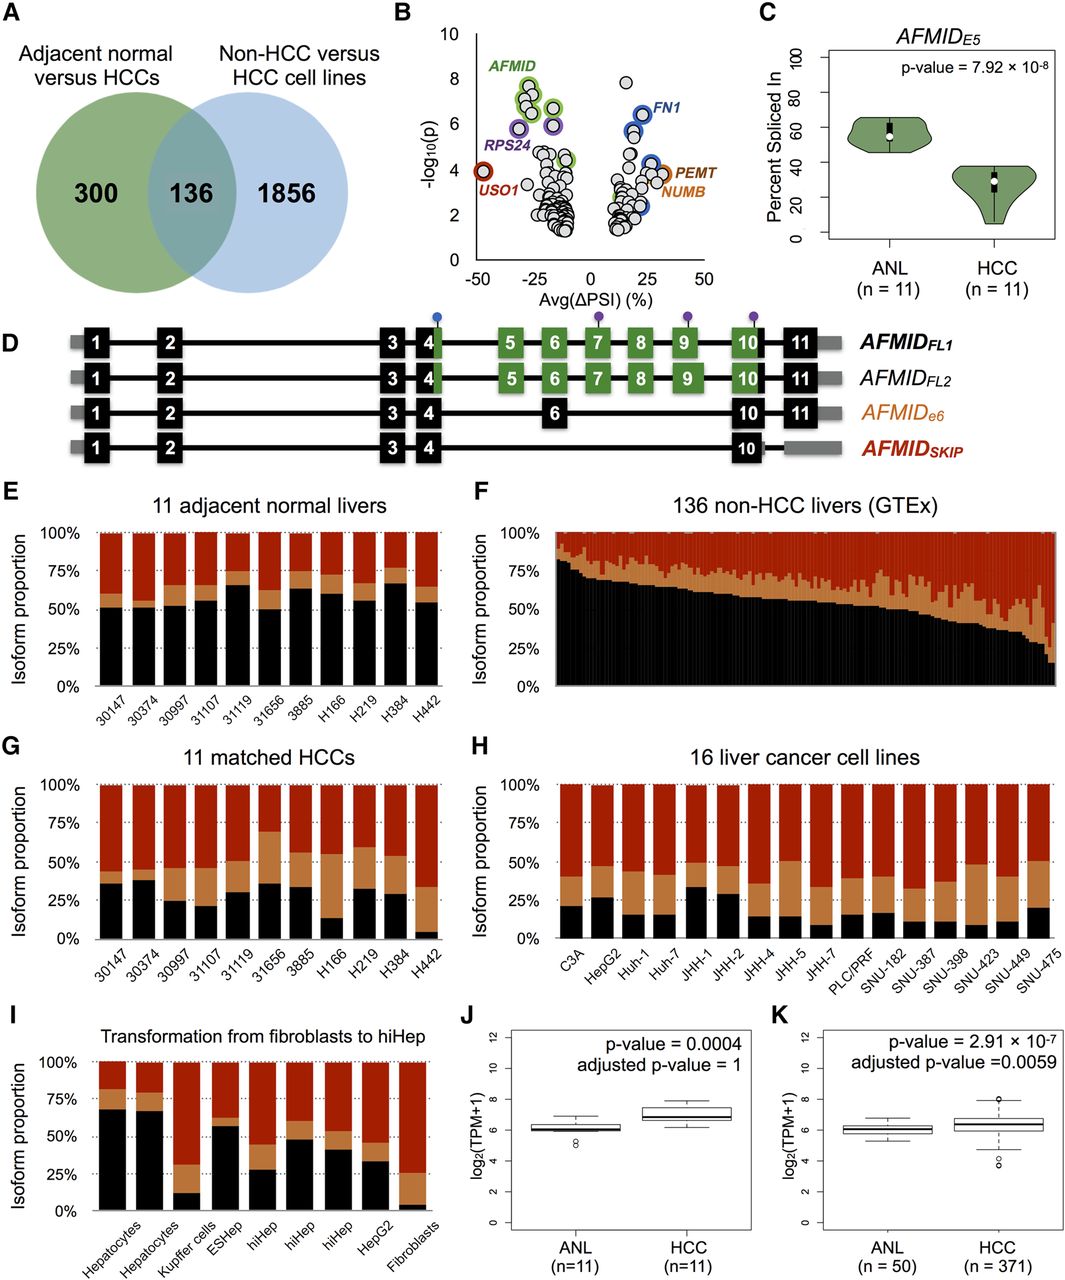
Concordant splicing events in HCC patient samples and liver-cancer cell lines. (A) The Venn diagram shows the number of overlapping splicing events between two independent comparisons: 11 adjacent normal livers (ANLs) versus 11 matched HCCs (green circle); and 136 non-HCC liver samples versus 16 liver-cancer cell lines (blue circle). (B) Each dot in the dot plot represents an alternative exon. The color coding of the circles indicates different exons from the same gene. The x-axis shows the average PSI change of an alternative exon between ANL and HCCs. The y-axis is the statistical significance, denoted as −log10(p), of the splicing event in 11 ANLs versus 11 HCCs. (C) The vioplot shows the PSI distributions of exon 5 of AFMID in 11 ANLs and 11 matched HCCs. (D) Exon/intron structure of AFMID isoforms. Each dark block is a coding exon; the gray boxes represent the UTR exons or portions of exons; the green boxes denote domain regions. Three purple dots represent the active-site residues (Ser164, Asp247, and His279). The blue dot on exon 4 represents the HGGXW motif (the oxyanion hole). (E–H) The stacked bar charts in E and G represent the estimated proportion of AFMID isoforms in the 11 pairs of ANLs and matched HCCs, based on RNA-seq junction reads; F shows the 136 non-HCC liver samples, and H shows the 16 liver-cancer cell lines. (I) The stacked bar chart shows the PSIs of AFMID isoforms in human hepatocytes, Kupffer cells, hiHep cells (ESHep and hiHep), HepG2, and skin fibroblasts. (J,K) The two box plots show the overall gene-expression level of AFMID in 11 matched HCC patient samples and 371 HCC patient samples (50 with matched ANLs) from TCGA, respectively. Expression levels are shown as transcripts per million (TPM).


