
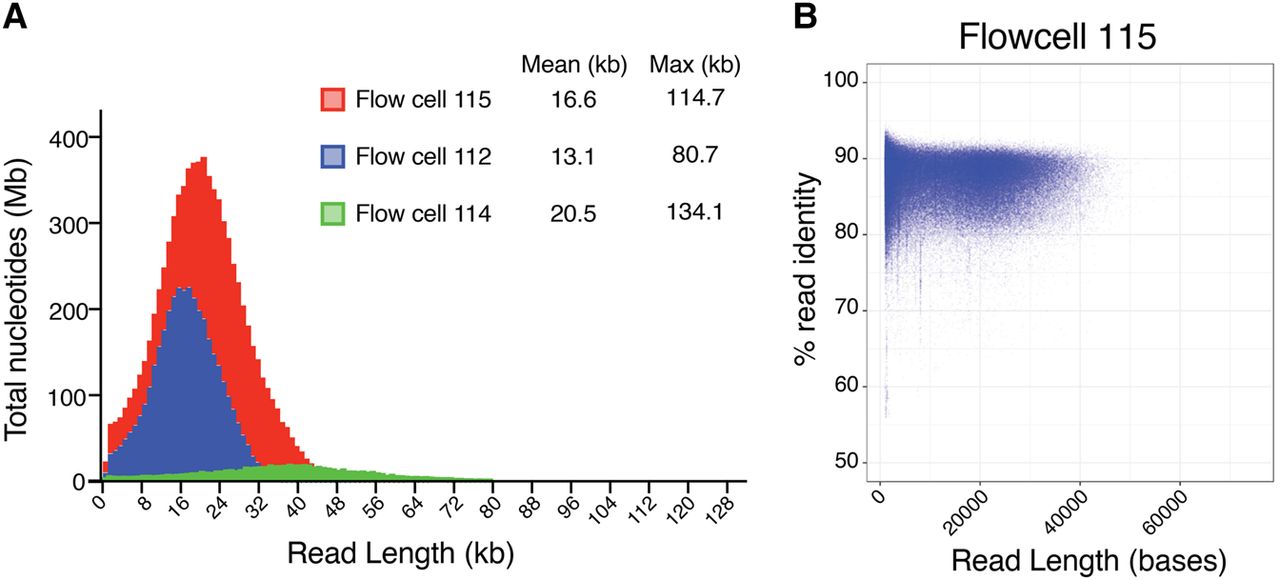
Figure 1.
Summary of MinION sequence reads of the C. elegans VC2010 wild-type strain genome. (A) Histograph of read lengths from flow cells 112, 114, 115. (B) Plot of % read identity aligned to the C. elegans reference genome vs. read length from flow cell 115. Mean % identities ranged from 85.90% to 86.35% for the three flow cells (Supplemental Fig. S1).


