
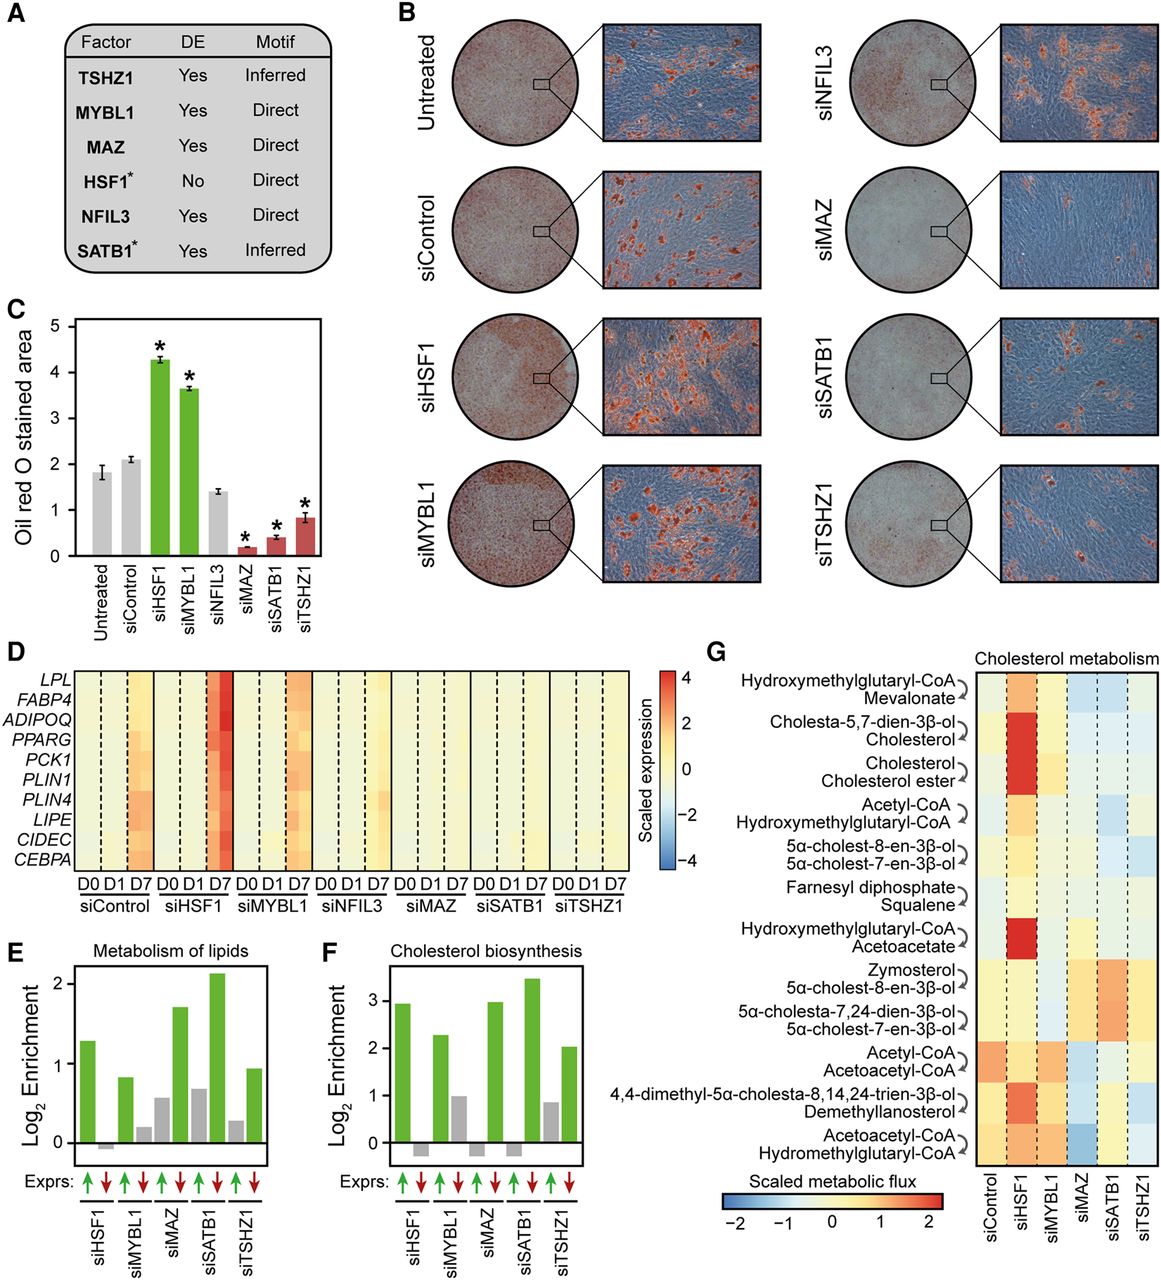
IMAGE predicts transcription factors controlling human MSC commitment and differentiation with high confidence. (A) Table listing the six transcription factors chosen among the transcription factors predicted to be causally involved in adipocyte differentiation of hMSC-TERT4 cells based on IMAGE analyses of enhancer activity (MED1 ChIP-seq, n = 2) and gene expression (RNA-seq, n = 2). It is indicated which genes are differentially expressed (DE: Padj ≤ 0.05) during adipocyte differentiation and whether motifs were experimentally derived (Direct) or inferred based on similarity to other transcription factors. (*) indicates that the motif was identified with medium confidence. (B,C) The majority of the causal transcription factors predicted by IMAGE have an impact on lipid accumulation. (B) Representative images at low and high magnification of Oil Red O staining of hMSCs transfected with the indicated siRNAs and differentiated to adipocytes for 14 d. (C) Quantification of the Oil Red O stained area using ImageJ from a 3×3 grid (nine random locations, recorded at 10× magnification) for each replicate (n = 2). (D) The candidate factors regulate the expression of adipocyte marker genes. The heat map shows the expression of 10 well-known adipocyte marker genes (lipoprotein lipase [LPL], fatty acid binding protein 4 [FABP4], adiponectin [ADIPOQ], peroxisome proliferator activated receptor gamma [PPARG], phosphoenolpyruvate carboxykinase 1 [PCK1], perilipin 1 [PLIN1], perilipin 4 [PLIN4], hormone sensitive lipase [LIPE], cell death inducing DFFA like effector c [CIDEC], and CCAAT/Enhancer binding protein alpha [CEBPA]) as determined by RNA-seq in hMSC-TERT4 cells differentiated to adipocytes for the indicated time points with or without knockdown of each of the candidate factors. (E,F) The candidate factors regulate the expression of genes involved in both metabolism of lipids and cholesterol biosynthesis in a manner that correlates with their impact on lipid accumulation. Enrichment of genes belonging to the ‘Metabolism of lipids’ (E) or the ‘Cholesterol biosynthesis’ (F) pathways (Reactome database [Croft et al. 2014]) among genes that are up-regulated and down-regulated upon knockdown of the indicated transcription factors. The bar plot shows the log2 enrichment of genes that are expressed to a significantly (Padj ≤ 0.05) higher (green upward facing arrow) or lower (red downward facing arrow) level at day 7 of differentiation upon the indicated knockdown compared to control. The enrichment is calculated by comparing the fraction of genes within that pathway that are expressed to either a higher or a lower level upon knockdown compared to control relative to the fraction of all genes that are expressed to either a higher or a lower level upon knockdown compared to control. Significant enrichments (Padj ≤ 0.1) are denoted with green bars. (G) The change in metabolic flux through most reactions assigned to cholesterol metabolism or squalene and cholesterol synthesis correlate with the change in lipid accumulation upon knockdown of the candidate factors. The heat map shows the predicted scaled and centered metabolic flux of all metabolic reactions assigned to cholesterol metabolism or squalene and cholesterol synthesis that reached a flux of at least 0.1 µmol per g dw per h. Metabolic fluxes were predicted by the SPOT method (Kim et al. 2016) from transcriptome data at day 7 in the different knockdowns and in the control using a model of human metabolism (Recon 2) (Thiele et al. 2013). The top step converting HMG-CoA to mevalonate is the rate-limiting step.


