
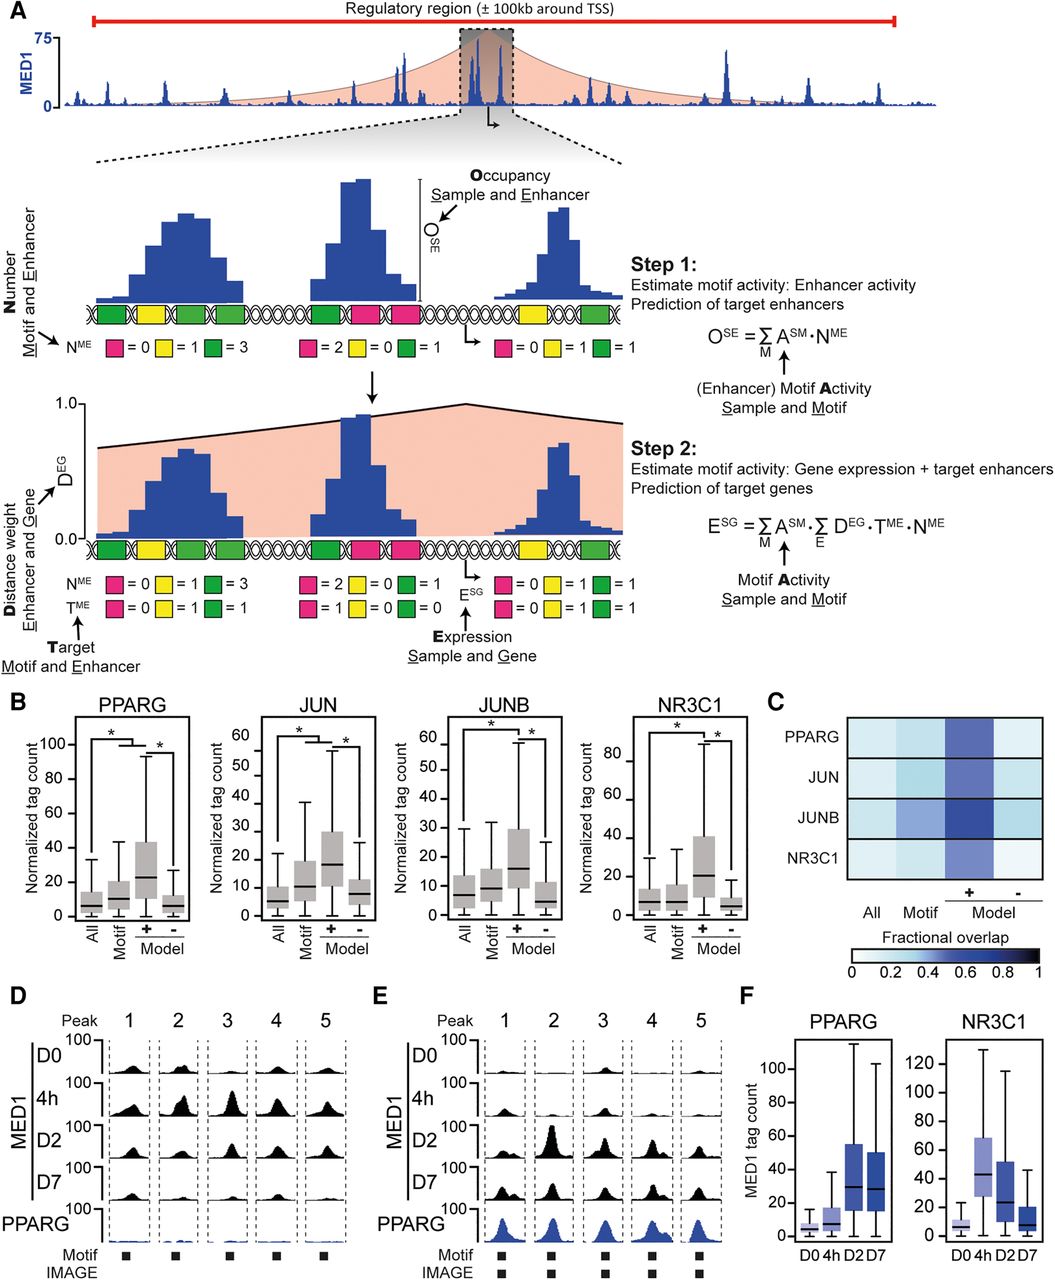
IMAGE predicts transcription factor binding sites with high confidence. The predictive power of IMAGE for identification of transcription factor binding sites was investigated using previously published data from 3T3-L1 preadipocyte differentiation (Siersbaek et al. 2011, 2017). (A) Schematic workflow of IMAGE. The shaded red area depicts the linear-distance association between enhancers and genes. The height illustrates the weight associated with each distance (y-axis on zoom-in). In step 1, the input sequences are scanned for motif occurrences using the P-value-based cut-off. Motifs that are only predicted to bind transcription factors that are expressed below one normalized tag per kilobase are filtered away. We define a variable M, which contains each remaining motif, a variable E which contains each enhancer, and a variable S which contains each sample. The motif activity of each remaining motif is determined using ridge regression to estimate ESM using the equation given in the figure. (OSE) Occupancy at enhancer E in sample S, (NME) number of motif M in enhancer E, (ESM) effect of motif M in sample S. Subsequently, target enhancers are predicted by leave-one-out analysis. In step 2, the effect of each motif on gene expression or motif activity is predicted using an additive model of transcriptional regulation and estimating ASM from the given equation. (DEG) Distance weight for enhancer E acting on gene G, (TME) target enhancer E of motif M, (NME) number of motif M at enhancer E, (ASM) motif activity of motif M in sample S. Subsequently, target genes are identified by leave-one-out analysis. (B,C) Validation of IMAGE binding site prediction during 3T3-L1 adipocyte differentiation using ChIP-seq. (B) Boxplots show the ChIP-seq occupancy of PPARG (6 d after induction of differentiation), JUN (4 h after induction of differentiation), JUNB (4 h after induction of differentiation), and NR3C1 (4 h after induction of differentiation) (Siersbaek et al. 2014) at either all putative enhancers defined by MED1 signal (all), all putative enhancers containing the respective transcription factor motif (motif), all enhancers predicted to be target enhancers of the transcription factor by IMAGE (Model+), or all enhancers predicted not to be target enhancers of the transcription factor by IMAGE (Model−). (*) denotes a significant (P ≤ 0.05) and nonnegligible effect (|Cohen's d| ≥ 0.2). (C) Heat map indicating the fraction of the MED1 binding sites defined in B that overlap with peak-detected sites based on ChIP-seq data. (D,E) Examples of MED1-bound enhancers with PPARG motifs that are unbound ([D] Peak 1: Chr 3: 151738674, Peak 2: Chr 8: 11273745, Peak 3: Chr 11: 51687839, Peak 4: Chr 2: 167420113, Peak 5: Chr 3: 41234389) or bound ([E] Peak 1: Chr 6: 144702629, Peak 2: Chr 6: 82598119, Peak 3: Chr 7: 29610142, Peak 4: Chr 11: 98447544, Peak 5: Chr 4: 108506609) by PPARG. Screenshots were generated using the USCS Genome Browser showing MED1 ChIP-seq data from day 0, 4 h, day 2, and day 7, and PPARG ChIP-seq data from day 6 following adipogenic stimulation of 3T3-L1 preadipocytes. Presence of PPARG motifs and IMAGE predicted binding sites is indicated below the screenshots. (F) Predicted enhancers of PPARG and NR3C1 have a temporal pattern of activation that is congruent with the activation of the transcription factors. The boxplots show the MED1 tag count at predicted target enhancers of PPARG and NR3C1 at the indicated time points during differentiation in 3T3-L1 cells.


