
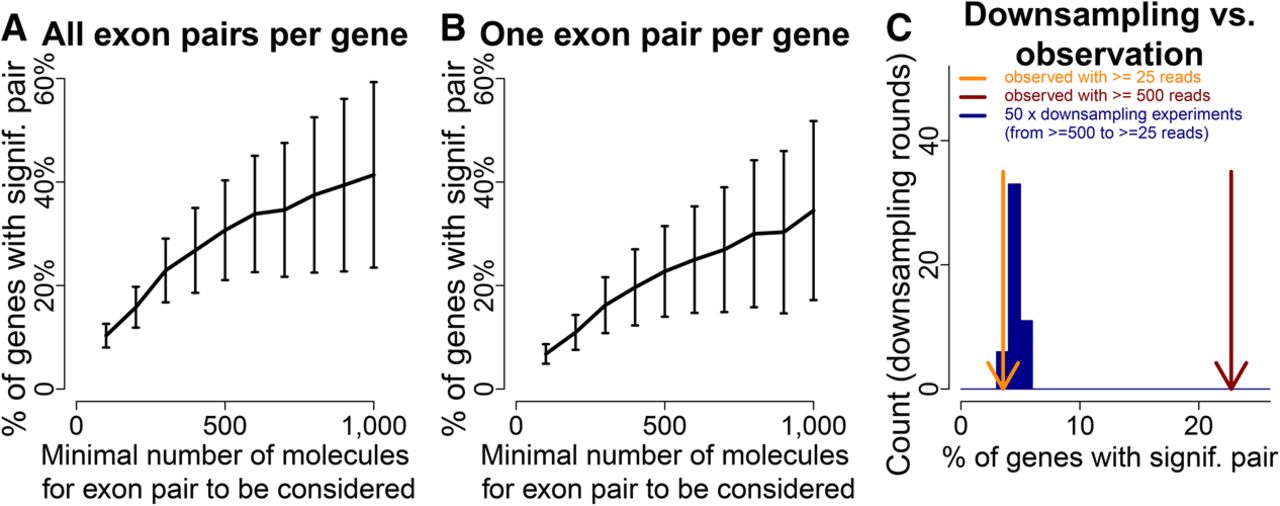
Estimation of genes with coordination genome-wide. (A) Percent of genes (among genes with one tested exon pair at a given cutoff) that show at least one coordinated exon pair with P < 5 × 10⁻⁷ and absolute value log-odds-ratio of 0.5 or above. Vertical bars indicate 95% confidence intervals. (B) Same figure as A, considering only one exon pair per gene: the one with the highest number of informative reads. Vertical bars indicate 95% confidence intervals. (C) Orange arrow indicates percentage of genes with ≥25 informative reads that have a coordination event. Red arrow indicates the same percentage for genes with 500 informative reads. Blue distribution shows 50 lists of exon pairs, down-sampled from the “≥500 informative read” data to the “≥25 informative read data.”


