
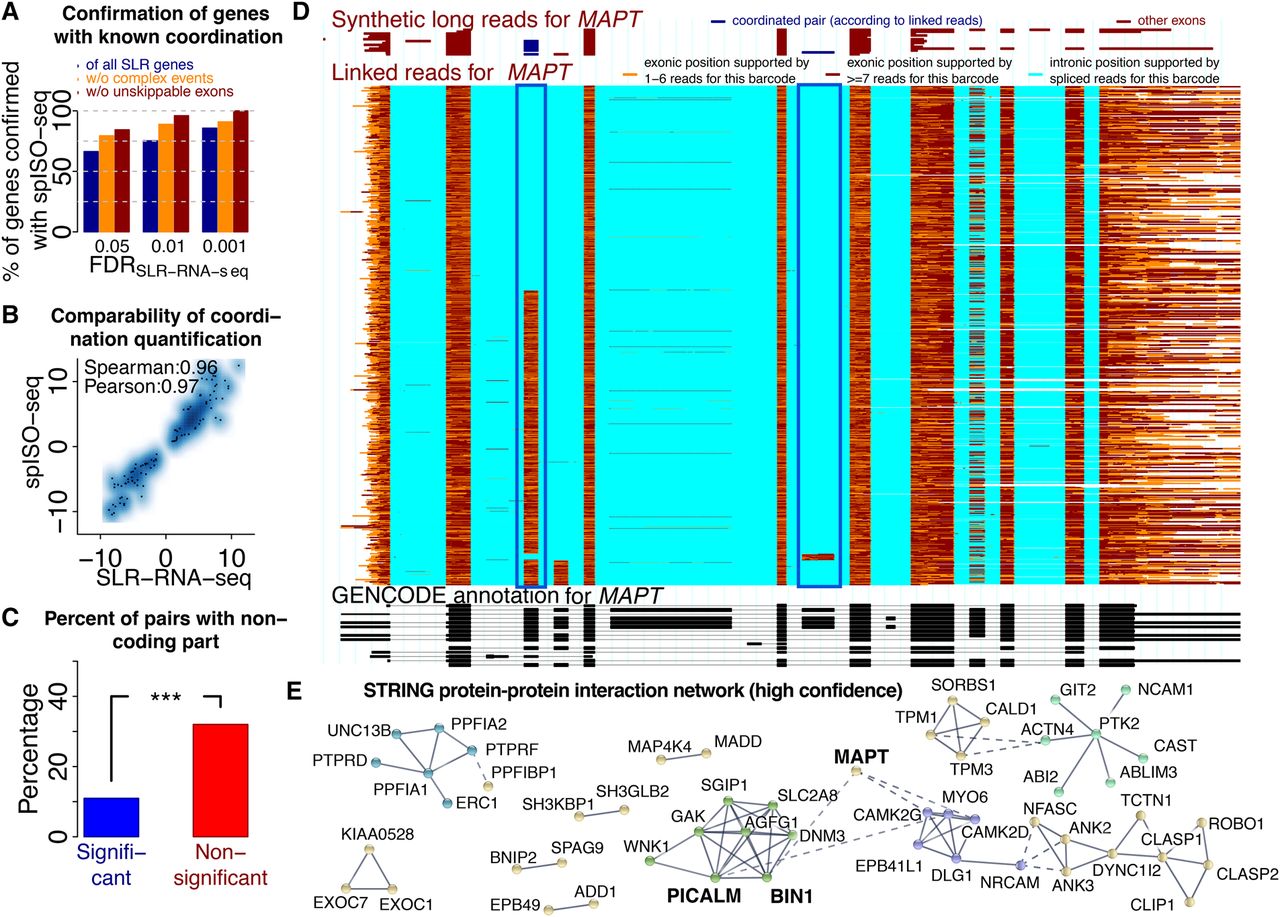
Coordinated exon pairs and influences on protein–protein interactions. (A) Percentage of genes with coordination events found by SLR-RNA-seq at three different FDRs that are also found with spISO-seq at FDR of 0.05. Blue bars: all SLR-RNA-seq coordination genes; orange bars: only SLR-RNA-seq genes, in which most molecules (Methods) show only exon inclusion and exon exclusion; brown bar: only SLR-RNA-seq genes, in which most molecules (Methods) show only exon inclusion and exon exclusion and where skipping events are mappable using short reads and STAR (Dobin et al. 2013). (B) Dotplot for extent of coordination according to SLR-RNA-seq and spISO-seq for cases in which both technologies indicate coordination. (C) Percentage of genes in which coordinated exons contain noncoding sequence for genes with coordination (FDR < 0.05) and without. (D) Single gene view for the MAPT gene, the center of all tauopathies. Bottom, black track: GENCODE annotation. Middle, colored track: spISO-seq data, with each line representing one molecule. Top, red-brown track: SLR-RNA-seq data with each line representing one molecule. Blue boxes highlight the inclusion of two alternative exons, whose inclusion is anticorrelated. (E) Protein–protein interaction network for genes with splicing coordination.


