
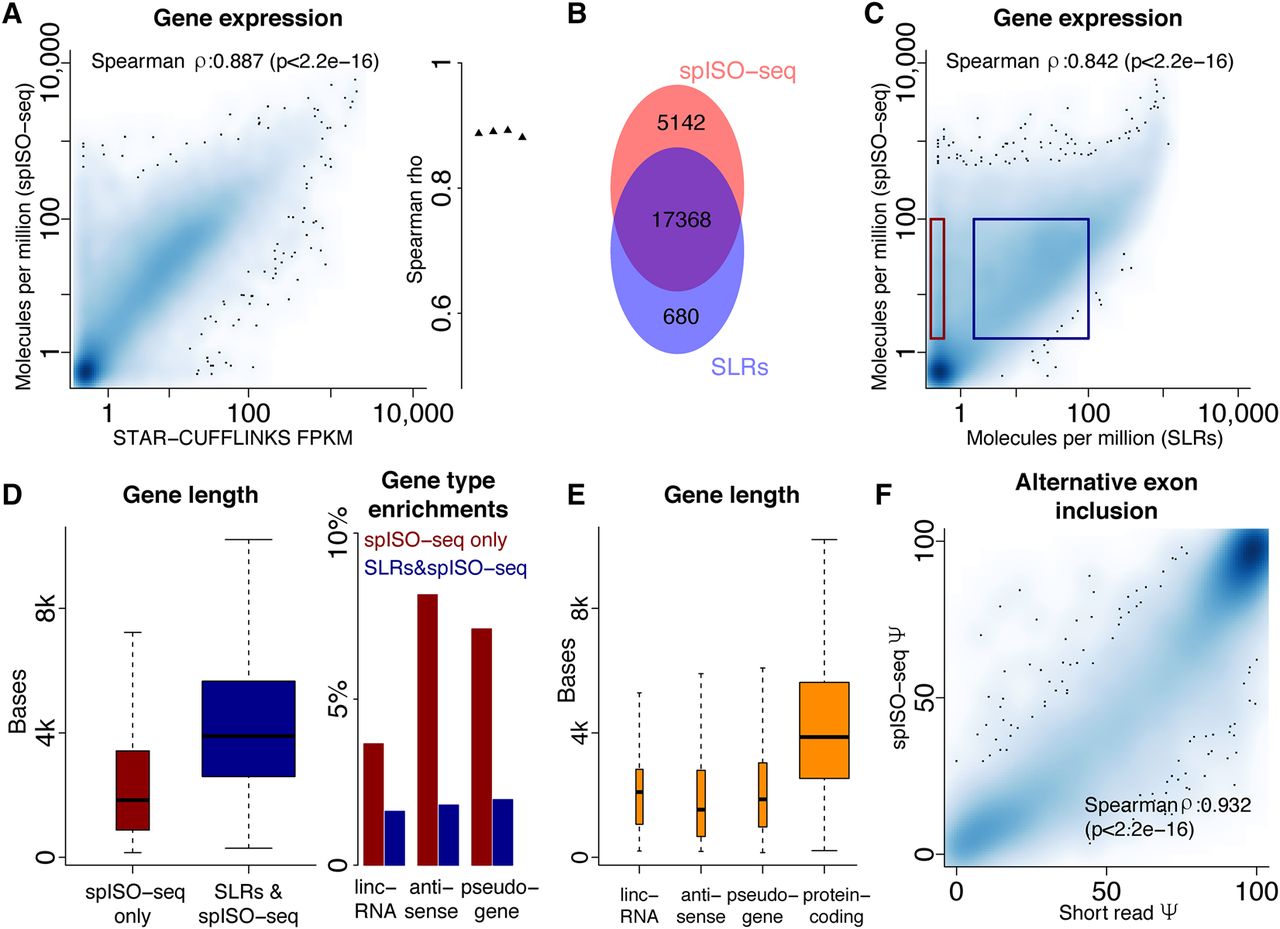
Figure 4.
Gene quantification. (A) Dotplot of gene expression from published short-read data (Li et al. 2014) and molecules per million of spISO-seq. (B) Overlap of genes identified by spISO-seq's linked reads and SLR-RNA-seq's SLRs. (C) Dotplot of gene expression from published synthetic long-read data (Tilgner et al. 2015) and molecules per million of spISO-seq. (D) Gene length and gene type enrichments for genes found only with spISO-seq and those found with spISO-seq and SLR-RNA-seq (Tilgner et al. 2015). (E) Length for mature RNAs for four different gene classes. (F) Dotplot of Ψ-values of short-read RNA sequencing (x-axis) and of spISO-seq (y-axis).


