
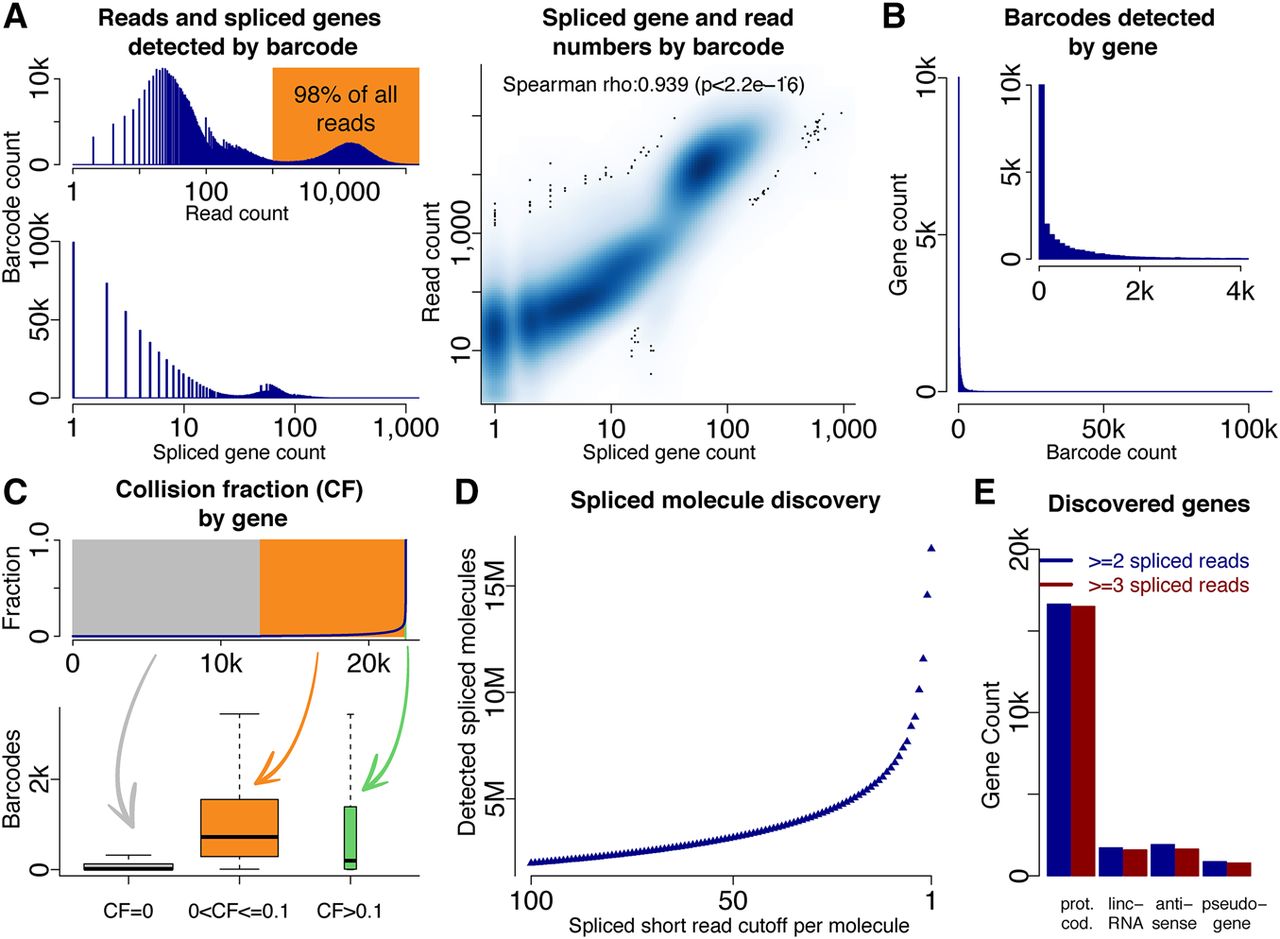
Molecule and gene identification using deep sequencing. (A) Histogram of read counts for all barcodes (top left), histogram of splice gene count for all barcodes (bottom left), and dotplot of spliced genes and short reads per barcode. (B) Histogram of barcodes per gene. (C) Percentage of barcodes with a collision for each gene; genes are ordered by collision fraction (top). Gene expression as measured by barcode number for many genes without collisions (gray), many genes with few collisions (yellow), and for very few genes with many collisions (green—not observable in top plot because of very low gene number). (D) Number of spliced molecules identified depending on how many spliced short reads identify an intron of the molecule's gene. (E) Numbers of genes identified in four gene classes (protein-coding genes, lincRNA genes, antisense genes, and pseudogenes).


