
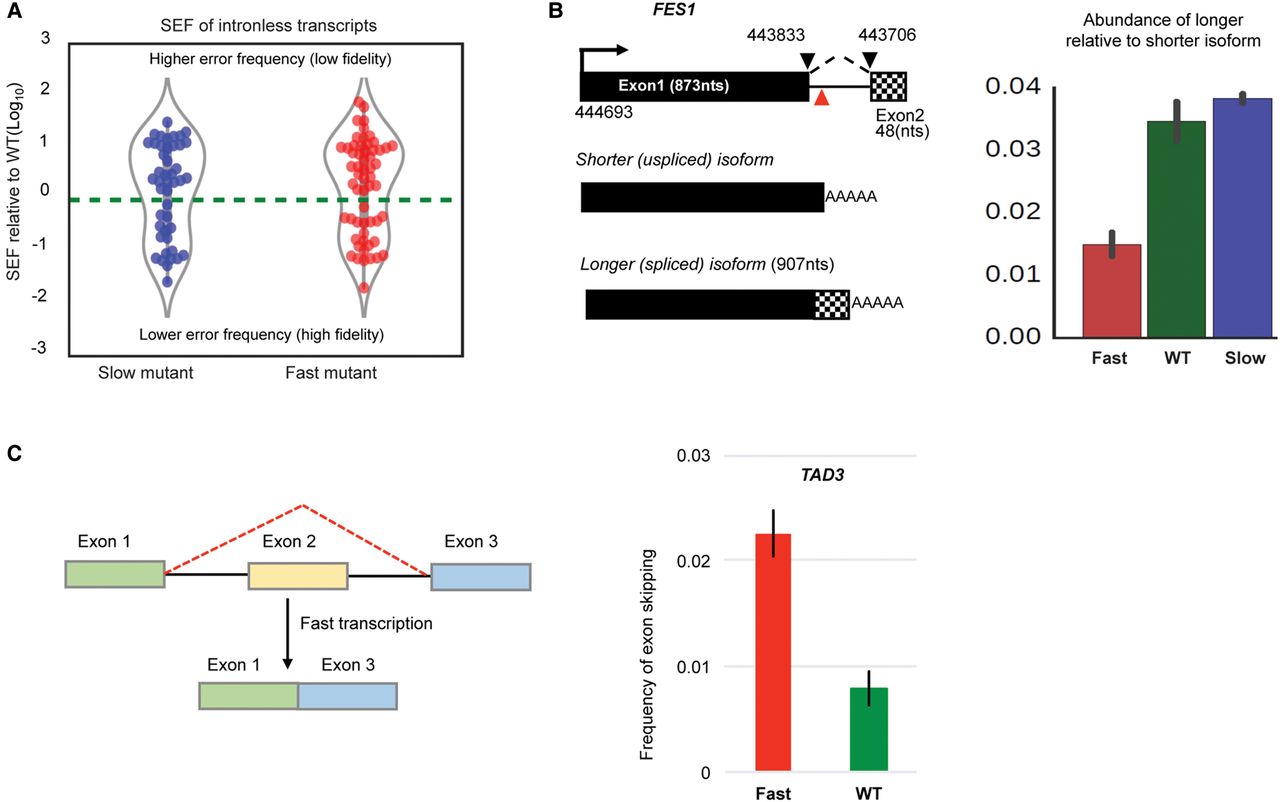
(A) Violin plots show the occurrence of cryptic splicing events within intron-less transcripts in the slow and fast mutants relative to WT. This plot includes all novel splicing events with significantly different SEF in mutants relative to WT (Fisher's exact test; P < 0.01). Points above the dashed line (zero) are splicing events with SEF greater than WT (reduced fidelity). Points below the dashed line are the events with improved splicing fidelity compared with WT. (B) Splicing of FES1 intron. Intron (ends connected by dashed lines) is 128 nt, and red triangle sign shows where promotor proximal polyadenylation occurs. Splicing of the intron generates a longer isoform. Barplot shows relative abundance of the longer (spliced) isoform relative to shorter isoform, measured by dividing junction read counts of longer isoform over FPKM of the shorter isoform. (C) Second exon skipping in TAD3 transcript with the fast mutant. To calculate frequency of exon skipping, the number of exon1–exon3 junction (exon skipping) reads was divided by the number of exon1–exon2 junction (first intron splicing) reads. A similar result is obtained by dividing by the number of exon2–exon3 junction reads.


