
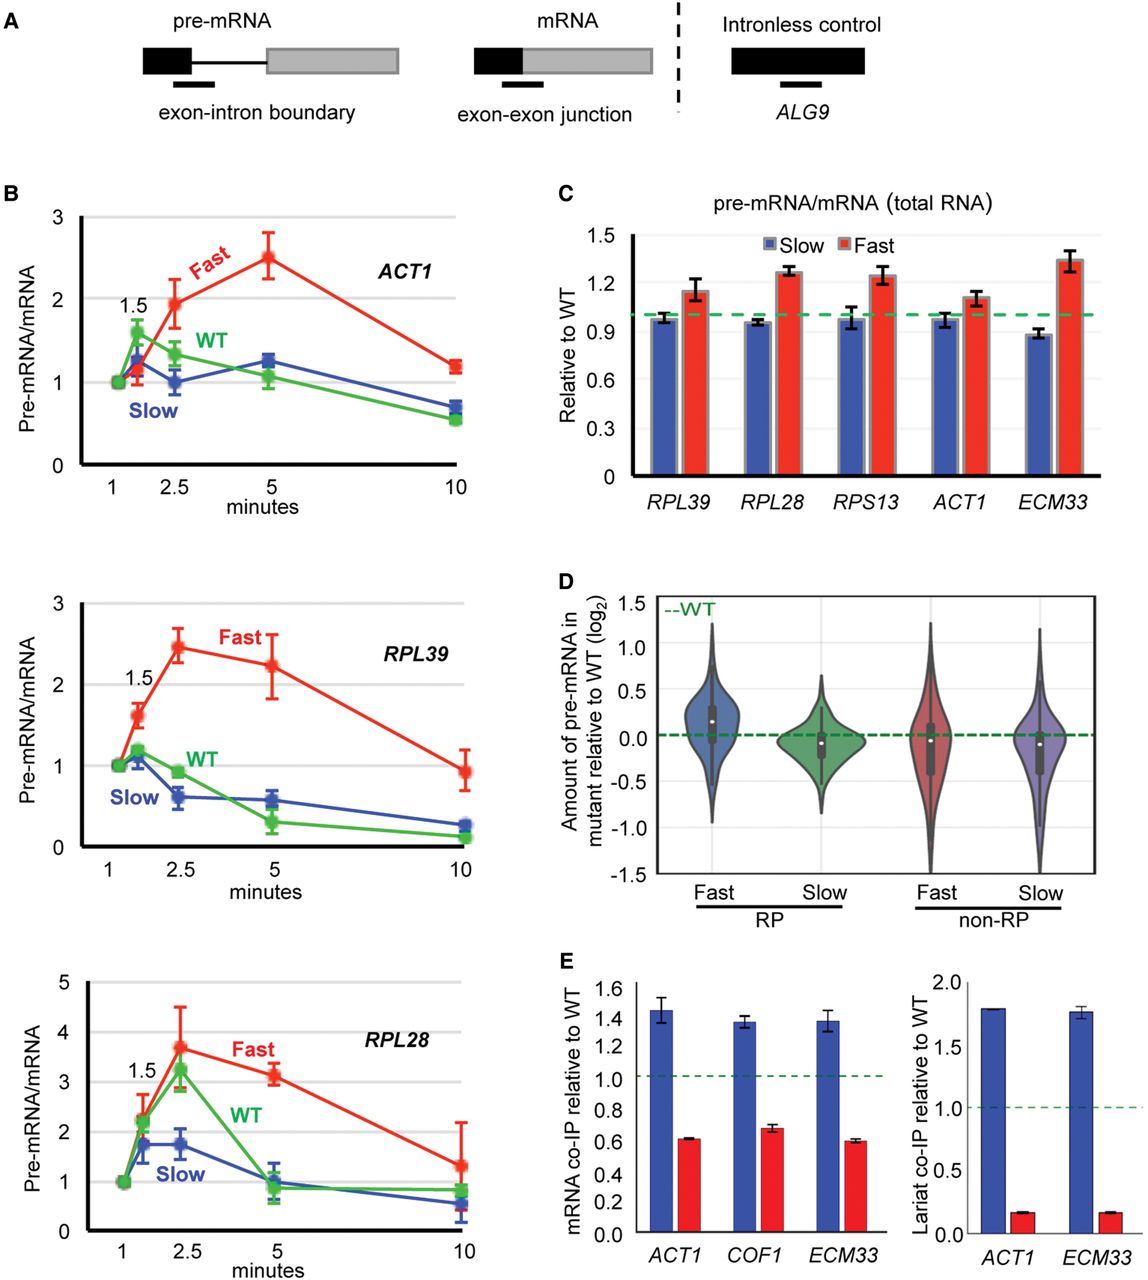
Fast elongation reduces and slow elongation enhances cotranscriptional splicing. (A) Diagram showing the location of RT-qPCR amplicons (lines below) for measuring pre-mRNA (exon–intron boundary at the 5′SS) and mRNA (exon–exon junction) levels. Black and gray boxes represent exons of intron-containing transcript or coding sequence of intron-less transcript (ALG9). (B) RT-qPCR results showing pre-mRNA/mRNA ratio for ACT1, RPL39, and RPL28 in fast (red), slow (blue), and WT (green) strains. To correct for amount of input RNA, values for pre-mRNA and mRNA were separately normalized to an intron-less transcript (ALG9) in the same sample. 4tU labeling was performed for 1, 1.5, 2.5, 5, and 10 min (x-axis), with all values plotted relative to the 1-min value. (C) Pre-mRNA/mRNA ratio of steady-state RNA for fast and slow mutants relative to WT (green dotted line). Error bars, at least three biological replicates. (D) Amount of pre-mRNA in the fast and the slow mutant relative to WT for RP and non-RP transcripts, measured by DICEseq (Huang and Sanguinetti 2016) from RNA sequencing data. (E) Fold enrichment of mRNA (left) and lariat-intron (right) association with RNAPII, in slow (blue) or fast (red) mutants relative to WT (green dotted line), measured by RT-qPCR. To correct for differences in the amount of RNA pull down, values for mRNA and lariat were separately normalized to RT-qPCR values for an intron-less transcript (ALG9). Error bars, three biological replicates.


