
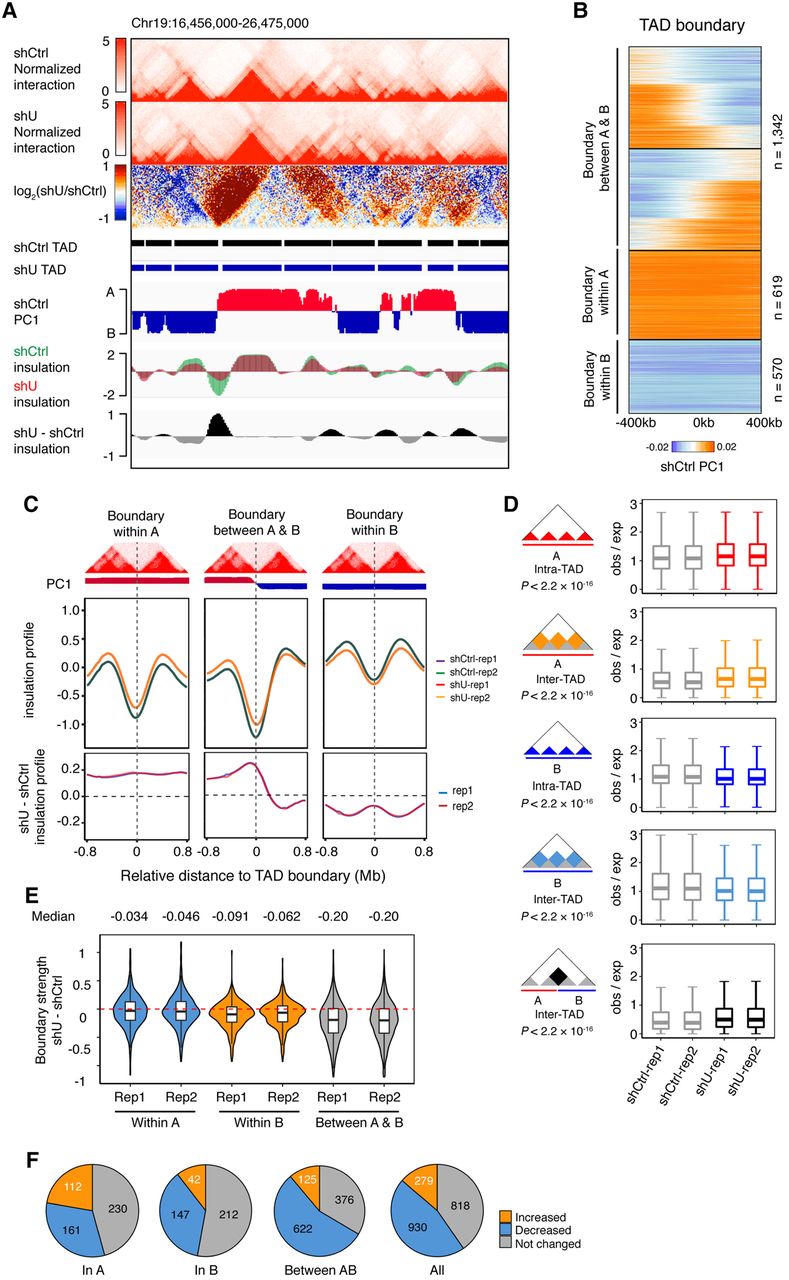
HNRNPU regulates TAD interactions. (A) A representative region showing interaction frequencies, insulation, and TAD boundaries at 40-kb resolution. (B) K-means clustering of TAD boundaries with surrounding PC1 values. (C) Insulation profile around TAD boundaries. (Top) Schematic view of three classes of boundaries relative to compartments. (Middle) Medians of insulation profile for each sample. (Bottom) Differences of insulation profile for each category. (D) Quantification of inter- and intra-TAD interactions in compartment A, B, and between A and B. P-values were obtained by two-factor ANOVA. (E) Violin plots showing degrees of boundary strength changes. Results from two replicates are presented. (F) Percentage of changed TAD boundaries in different categories.


