
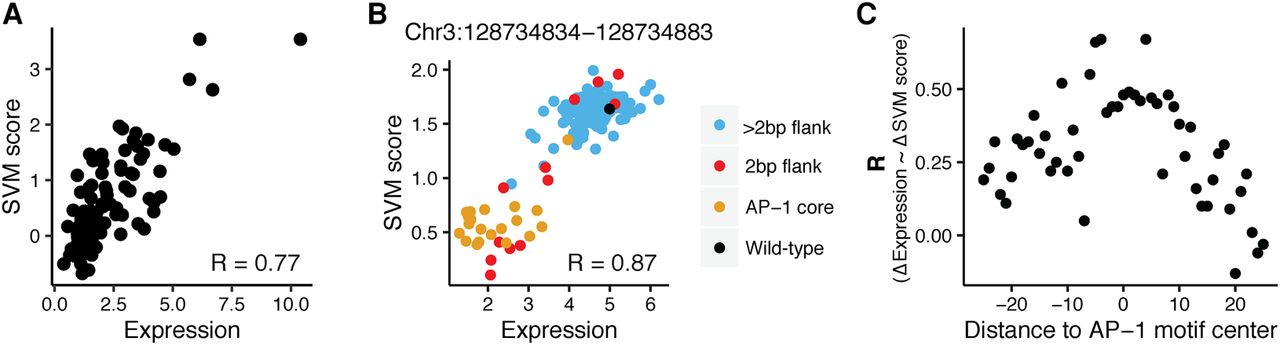
gkm-SVM scores quantitatively predict expression of wild-type sequences and effect of mutations. (A) gkm-SVM classifier trained on HIGH and LOW DHS sequences quantitatively predicted expression of sequences from the first library: (x-axis) expression of 81 cis-regulatory sequences; (y-axis) SVM score from the 10-mer gkm-SVM model in Figure 4B. (B) gkm-SVM classifier trained on HIGH and LOW DHS sequences accurately predicted the effect of substitutions in the AP-1 core motif and 2 bp flanking the AP-1 core tested in the saturation mutagenesis library. Data for substitutions in one sequence (Chr 3: 128734834–128734883) are shown: (x-axis) expression of sequences containing one substitution each; (y-axis) SVM score from 10-mer gkm-SVM model in Figure 4B. The model predicted loss in expression from wild-type sequence (black) when the substitutions are made in the AP-1 core (orange), and the effect of substitutions in 2 bp flanking the AP-1 site (red). Most substitutions outside of the core +2 bp flank (blue) have high expression and are not well predicted by the SVM. (C) Predictive power of the gkm-SVM model is inversely proportional to the absolute distance from AP-1 binding site. Substitutions from all 20 sequences in the saturation mutagenesis library were grouped by their distance from the AP-1 binding site: (x-axis) distance of the group of substitutions to the AP-1 core motif center; (y-axis) correlation coefficient between change in expression and change in SVM score compared to wild-type sequence for all substitutions in a group.


