
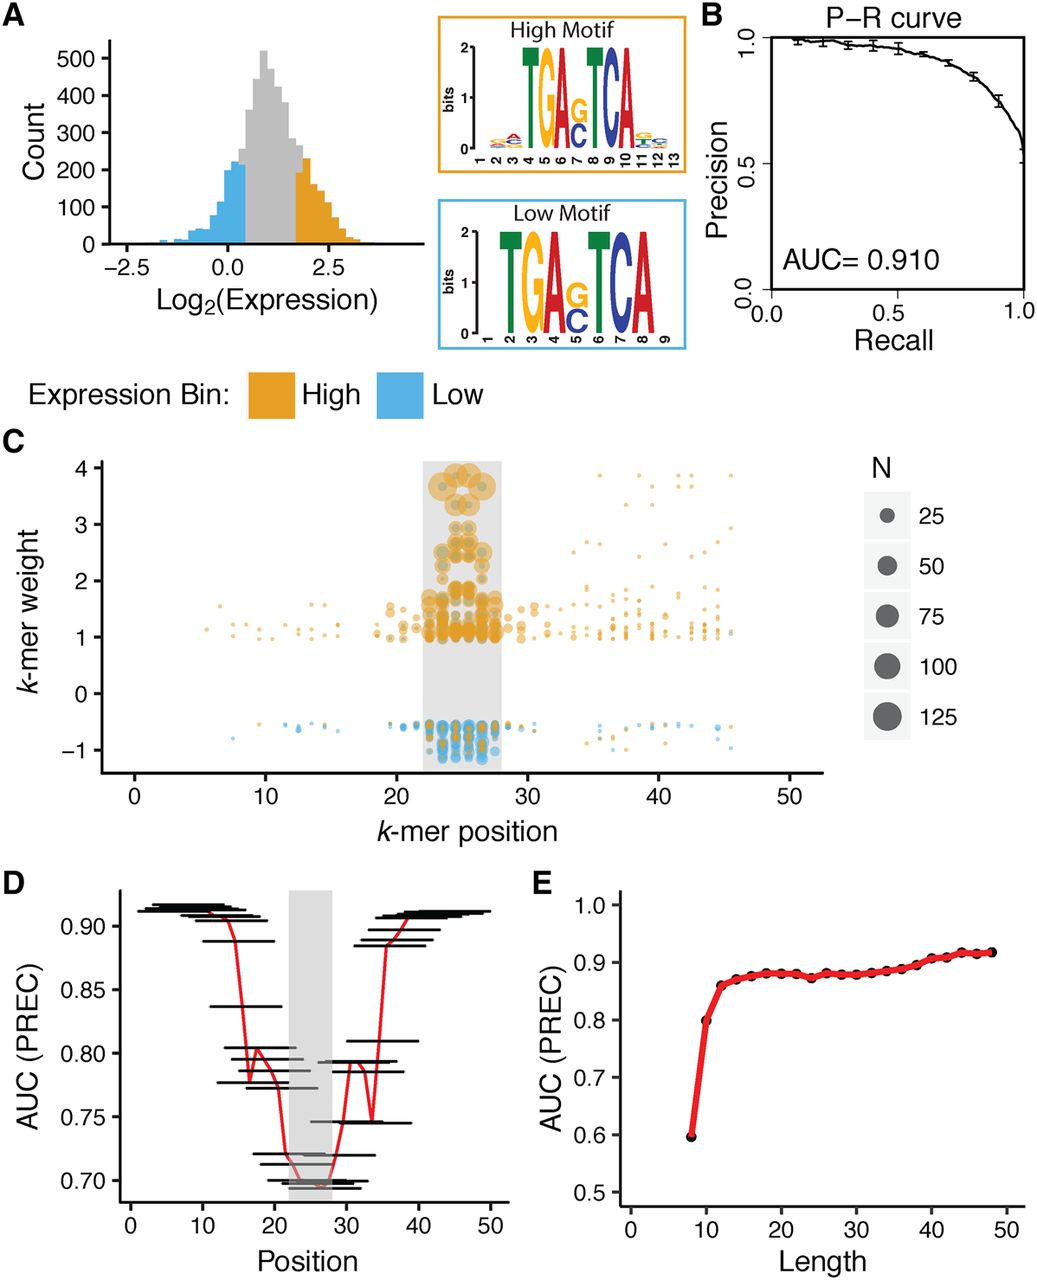
K-mers that distinguish HIGH and LOW DHS are enriched within 10 bp of the AP-1 core motif. (A) Expression distribution for 5000 sequences in DHS regions containing AP-1 sites. (x-axis) Log2(RNA/DNA) counts for barcodes representing particular cis-regulatory sequences (left). The top 1000 sequences are annotated as HIGH (orange), and the bottom 1000 sequences are annotated as LOW (blue). Motifs derived from HIGH and LOW sequences using MEME motif discovery tools (right). (B) gkm-SVM distinguishes between HIGH and LOW sequences within DHS. Precision-recall curve for a 10-mer gkm-SVM model trained on HIGH and LOW sequences (AUC = 0.91). Error bars show standard error from fivefold cross-validation. (C) K-mers that distinguish HIGH and LOW sequences overlap the AP-1 binding site. (x-axis) Position of the center of the k-mer along regulatory element in bp; (gray box) position of the AP-1 core motif; (y-axis) k-mer weight from gkm-SVM in B. Each point is an individual k-mer, and the size of the point denotes the number of sequences containing the k-mer. The color of the point indicates whether the k-mer was found in HIGH (orange) or LOW (blue) sequence. The top 400 k-mers, 200 with positive weights and 200 with negative weights are shown. (D) In silico deletion experiment also highlights that most informative k-mers overlap with the AP-1 core motif. A 10-bp region of every sequence was masked (horizontal black lines), and a 10-mer gkm-SVM model was refit. The x-axis shows the position of the masked segment along regulatory elements, and the y-axis shows the area under precision-recall curve from the resulting model. The gray box depicts the position of the AP-1 core motif, and the red line connecting the centers of the black bars highlights the trend of AUC values across the sequence. (E) Specification of HIGH and LOW groups lies within the central 12 bps. Sequences were shortened by removing one base from both ends and a 6-mer gkm-SVM model was refit: (x-axis) length of the shortened sequence; (y-axis) area under precision-recall curve. The red line connecting the centers the points highlights the trend of AUC values across the sequence.


