
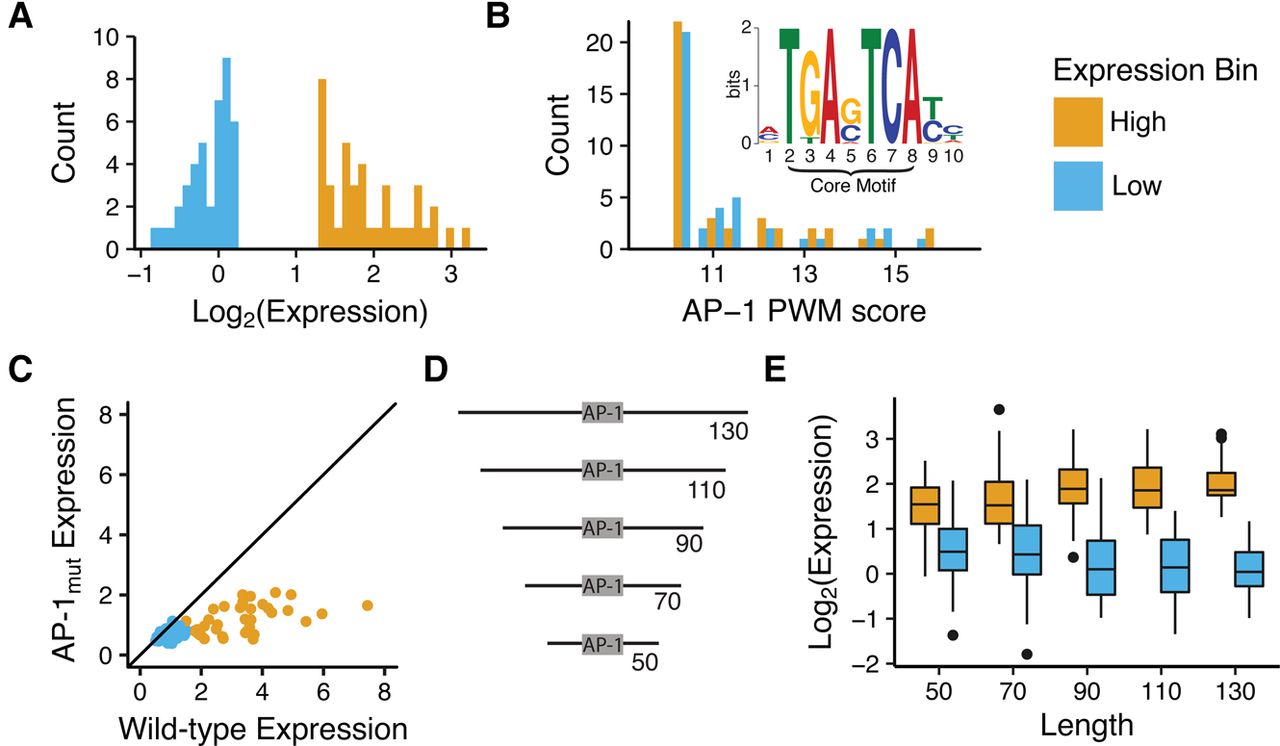
Comparison of 41 LOW activity and 40 HIGH activity sequences. (A) Expression distribution for selected AP-1-containing sequences. HIGH activity sequences (orange) drive stronger expression than LOW sequences (blue). (B) Distributions of AP-1 motif scores for HIGH (orange) and LOW (blue) sequences. Scores were derived using FIMO (Grant et al. 2011) from the JUNB position weight matrix (PWM) in the JASPAR database (Bryne et al. 2008) (inset). (C) Dependency of expression on intact AP-1 binding sites. Expression driven by wild-type sequences (x-axis) plotted versus expression driven by sequences with inactivated AP-1 sites (y-axis). Most points are below the diagonal (solid black line), indicating the importance of an intact AP-1 binding site for cis-regulatory activity. (D) Schematic shows five different length variants created for each sequence. (E) HIGH and LOW sequences contain regulatory information near the AP-1 core motif. Box plots for the activities of 40 HIGH (orange) and 41 LOW (blue) sequences are shown for different length variants. (x-axis) Total length of sequence including the AP-1 core; (y-axis) expression measured in MPRA assay. HIGH and LOW sequences are significantly different at 50 bp (Wilcoxon test, P = 1.86 × 10⁻⁹).


