
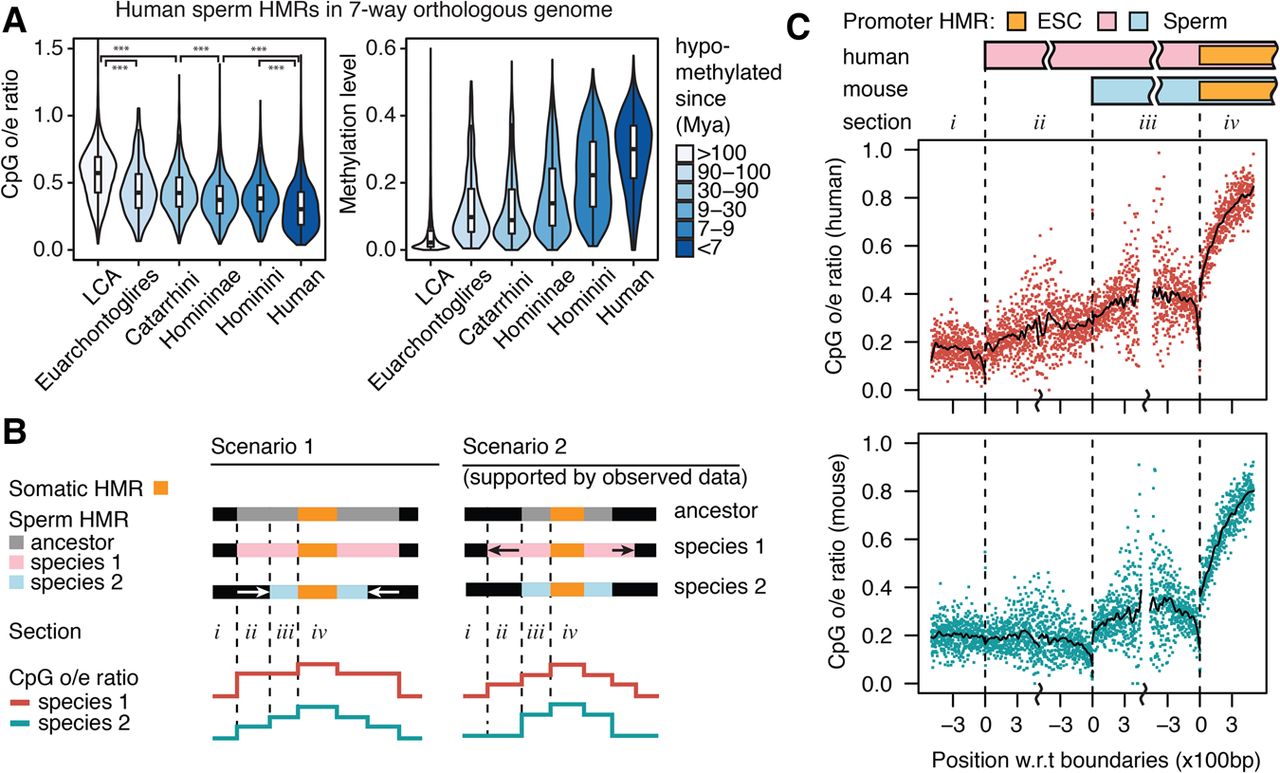
Sequence signatures driven by sperm methylome evolution. (A) CpG enrichment (observed/expected ratio of CpG occurrences) and regional average DNA methylation level in human HMRs in seven-way orthologous genome grouped by estimated hypomethylation age. (B) Two opposite scenarios explaining the evolution path to different promoter HMR sizes in two extant species and the expected CpG enrichment schematic profile in the extant species as a result of methylation-induced CpG decay. (C) Human and mouse CpG enrichment profile at hypomethylated orthologous gene promoters, where human sperm HMRs are wider than mouse. Profiles show CpG enrichment in 2-bp windows by distance to indicated HMR boundaries. Smoothed lines were generated with local polynomial regression fitting (LOESS).


