
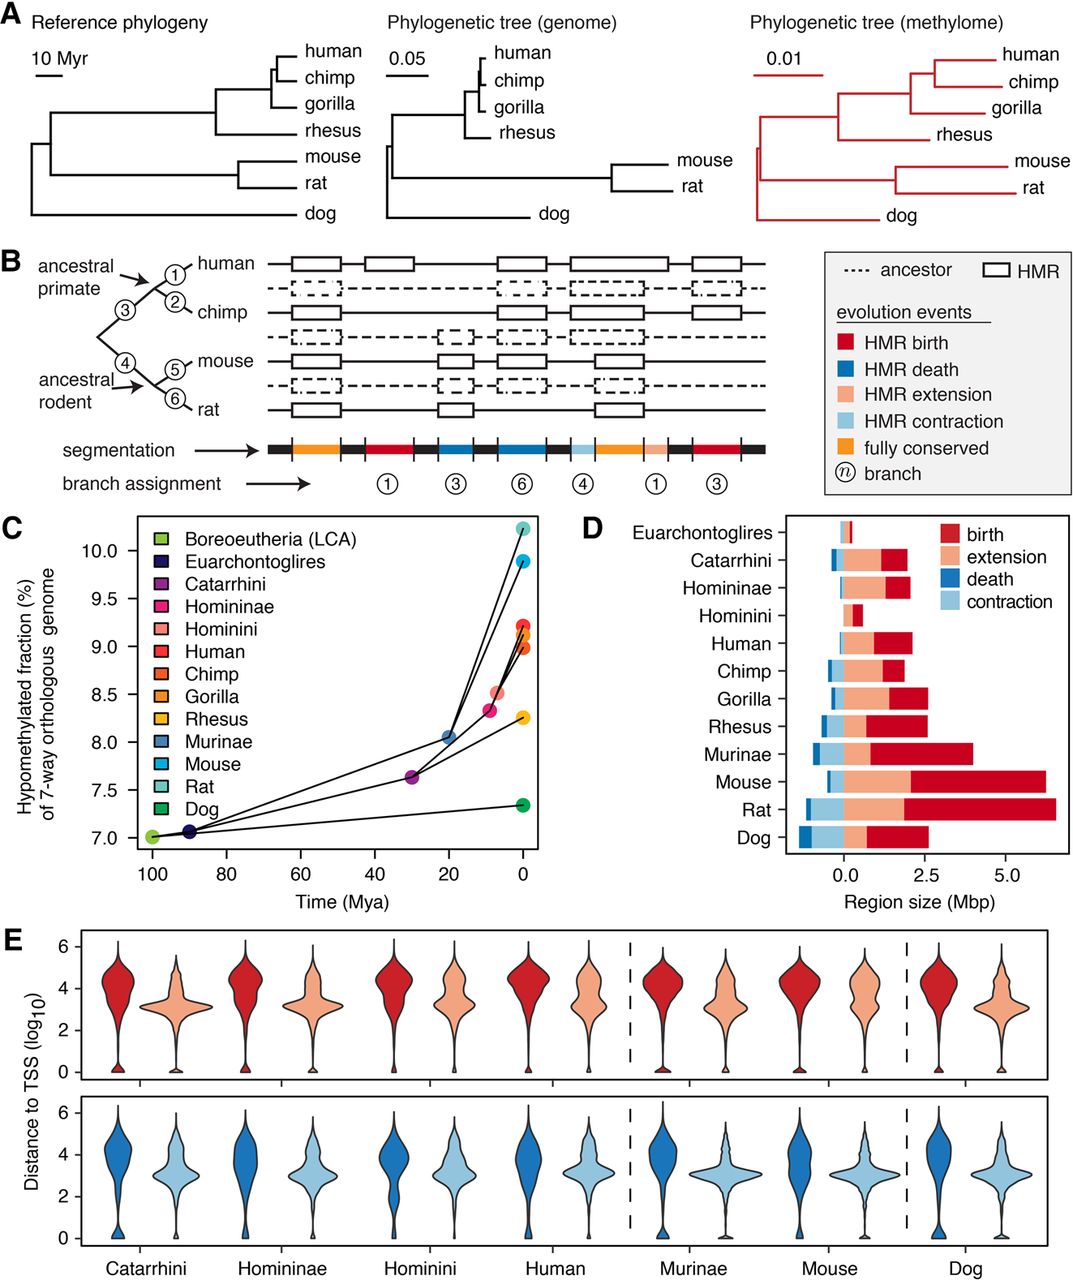
Methylation loss exceeds methylation gain during evolution. (A) Phylogenetic tree representing consensus divergence time (Hedges et al. 2015) genome evolution and sperm methylome evolution. Unit branch length represents 1 million yr, one substitution/site, and one methylation state change/CpG site, respectively. (B) Schematic segmentation of the orthologous genome according to the history of methylation evolution and annotation of methylation mutation events. (C) Fraction of orthologous genome hypomethylated in extant and ancestral species, estimated by the interdependent-site phylo-epigenetic model. (D) Total size of different types of methylation evolution events on individual branches. (E) The distribution of distances from methylome evolution events to closest TSS in the seven-way orthologous genome. The color legend is as shown in D.


