
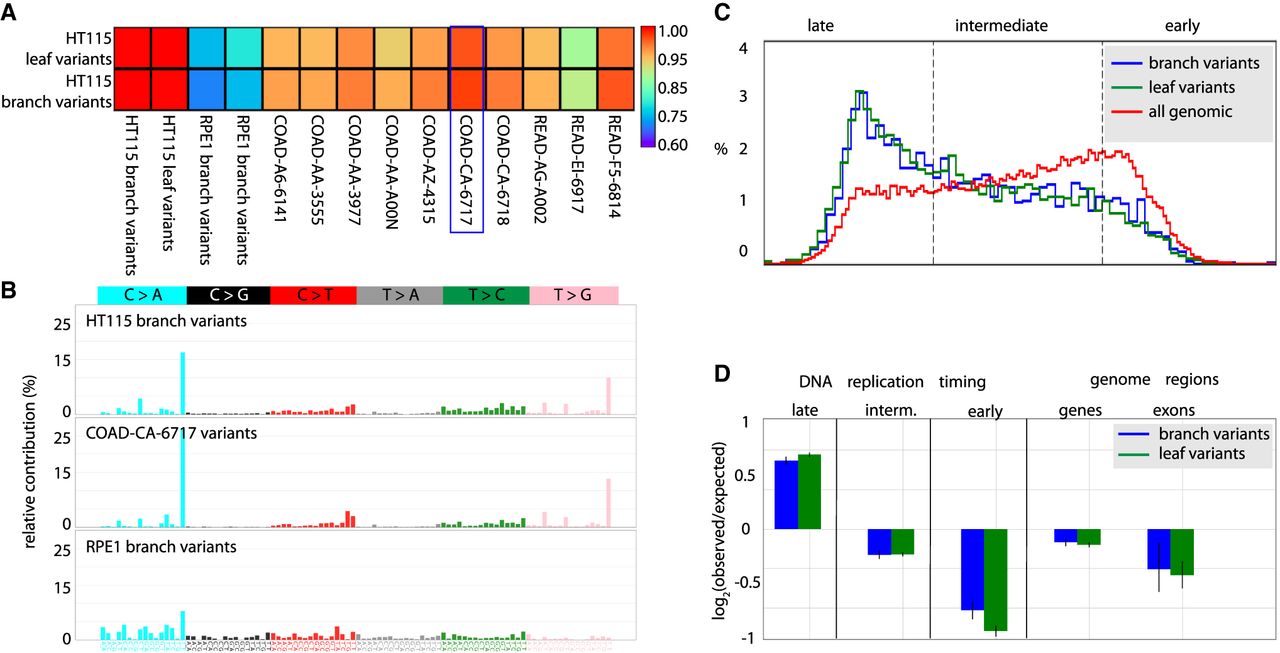
Analysis of mutation patterns in human colon carcinoma epithelial cell line HT115. HT115 shows POLE proofreading deficiency that matches previously published bulk POLE mutant colon tumor sample data. (A) Heat map showing the cosine similarity scores of comparisons of whole-genome HT115 variant SNV mutation spectra with whole-genome spectra from RPE1 samples and published data sets from POLE mutant tumor samples (Cancer Genome Atlas (TCGA), dbGAP: phs000178.v1.p1; sample annotations in Supplemental Table S1). The blue rectangle denotes the most similar tumor sample (COAD-CA-6717). (B) Comparison of detailed mutation spectra of all base substitutions observed in HT115 and RPE1 cell line branch variants and in the COAD-CA-6717 TCGA sample. HT115 and COAD-CA-6717 show highly similar spectra that differ from the RPE1 spectrum. (C) Distribution of DNA replication timing for all genomic positions and the somatic SNV branch variants and leaf variants (blue and green, respectively) from the HT115 cell line. Both the branch and leaf variant sets show the expected enrichment in late-replicating regions and depletion in early-replicating regions versus the background distribution of replication timing at all genomic loci (red). (D) Quantification of the enrichment and depletion of SNVs in the indicated categories. SNVs are enriched in the late-replicating regions while SNVs are depleted in RefSeq genic regions and further depleted in RefSeq exons (P < 0.01) in both the branch and leaf variant SNV sets.


