
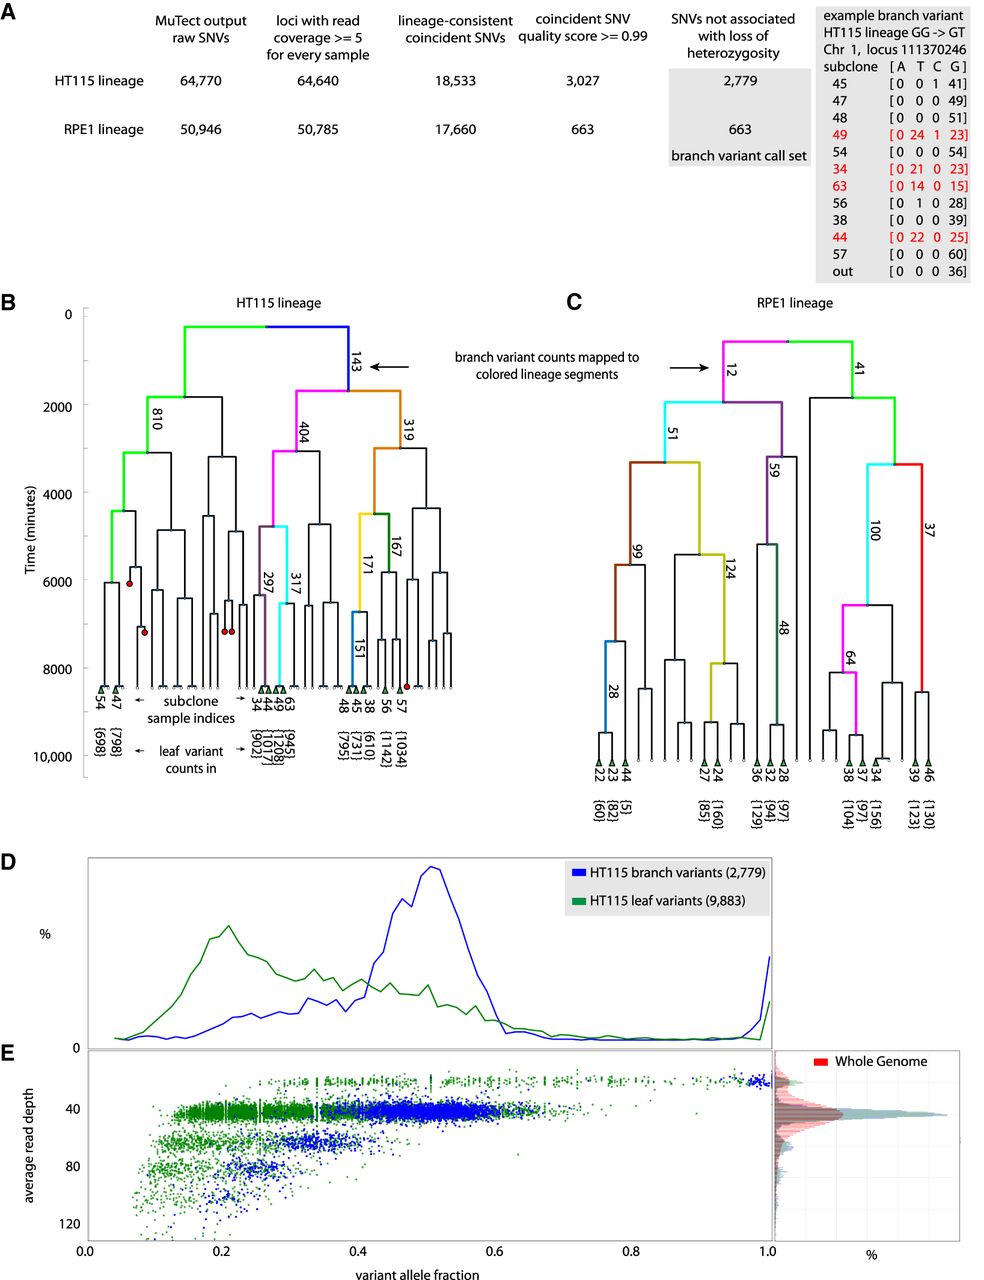
HT115 and RPE1 lineage sequencing experiments by the “optical tracking → lineage → called variants” approach. (A) Scheme of the analysis pipeline for identifying branch variant SNVs by the “optical tracking → lineage → called variants” approach. “Branch variants” are SNVs that occur at the same locus in two or more (but not all) subclones and are consistent with prior lineage information. Variant counts at different stages of the informatics filtering steps used to identify high-quality lineage structure concordant branch variants are shown for the HT115 and RPE1 lineage sequencing experiments. Detail on an example HT115 GG → GT branch variant is shown. Allele counts from sequence reads at Chromosome 1 diploid locus 111370246 are shown. Four subclone sequence libraries (subclone indices 49, 34, 63, and 44, marked in red) show about half the reads indicating a variant T allele, where all the other subclones support only the reference G alleles at this locus. This G → T SNV is scored as one of 404 branch variants that appeared within the two cell cycles represented by the pink segment on the right-hand side of the dendrogram representing the HT115 lineage experiment in B. (B,C) Dendrograms representing the HT115 and RPE1 lineage experiments; red circles mark time points where cells died during the lineage development and were not available for recovery from the device. The green triangles in the bottom of the dendrogram represent cells that were recovered, subcloned, and sequenced. Dendrograms are annotated with the count of “branch variants” for resolved lineage segments (some segments are resolved to individual cell cycles). Every sequenced subclone is annotated with its index number and the count of “leaf variants” for each sequenced subclone (at bottom). “Leaf variants” are SNVs that are supported by only one subclone and likely represent variants that arose during or after the last generation of the lineage experiment. The x-axis of the dendrogram only relates to linkage of the subclones. The y-axis of the dendrogram represents the culture time course, with each cell division event observed by time-lapse imaging marked by a branch point in the dendrogram. Single cells were recovered for subculture from the HT115 lineage after 141 h, while cells were recovered from the RPE1 lineage after 168 h. (D) HT115 branch variants are clonal. Histogram of allele fraction for detected variants. Comparison between branch variants (mutations occurring during lineage formation up to the last cell division) and leaf variants (mutations occurring within or subsequent to the last cell division event in the lineage). Branch variant SNVs show a bimodal allele fraction distribution peaked at 0.5 and 1.0 as expected for the measured ploidy (copy number variation [CNV] analysis) at variant loci in this mostly diploid cell line. In contrast, subclonal mutations appear in the leaf variant group and show an allele fraction distribution peaked well below 0.5 as the variant caller attempts to balance sensitivity for low allele fraction variants with false-positive detections without the enhanced performance available for branch variants. (E) Left panel: scatter plot of variants; average read depth versus allele fraction; branch variants (blue) and leaf variants (green). The branch variant read depth is tightly correlated with the variant allele fraction in accordance with clonal mutations. The leaf variants include many subclonal variants that blend with technical noise at low variant allele fractions. Right panel: normalized histogram of read coverage depth for HT115 lineage; whole-genome (red), called branch and leaf variants (blue and green).


