
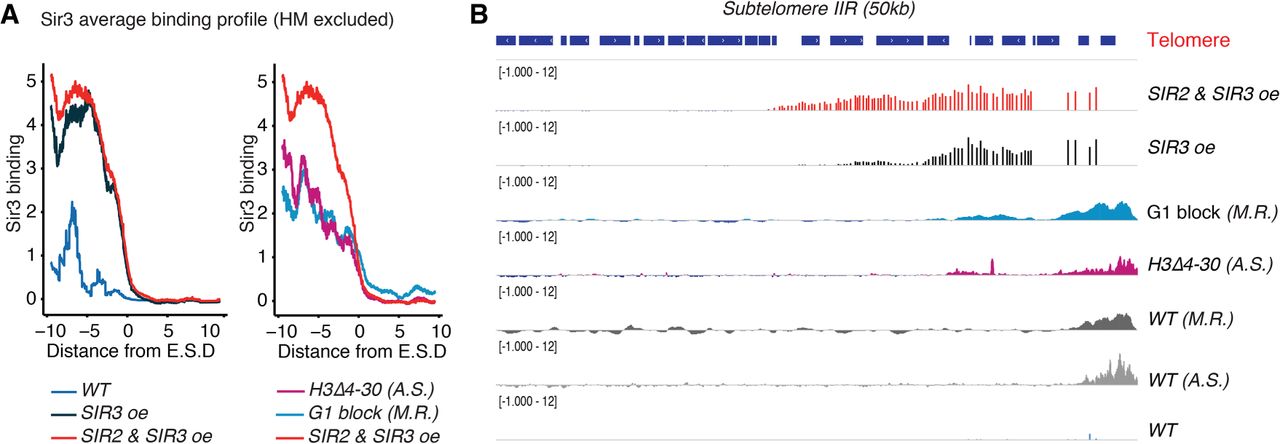
Figure 4.
ESDs encompass known domains of Sir3 extension. (A) Moving average of Sir3 binding (block = 1000 bp, window = 10) at the end of ESDs in the indicated conditions or mutants. (B) Genome browser visualization of Sir3 binding at subtelomere IIR; all data are shown as Z-score with a lower bound of −1 and an upper bound of 12.


