
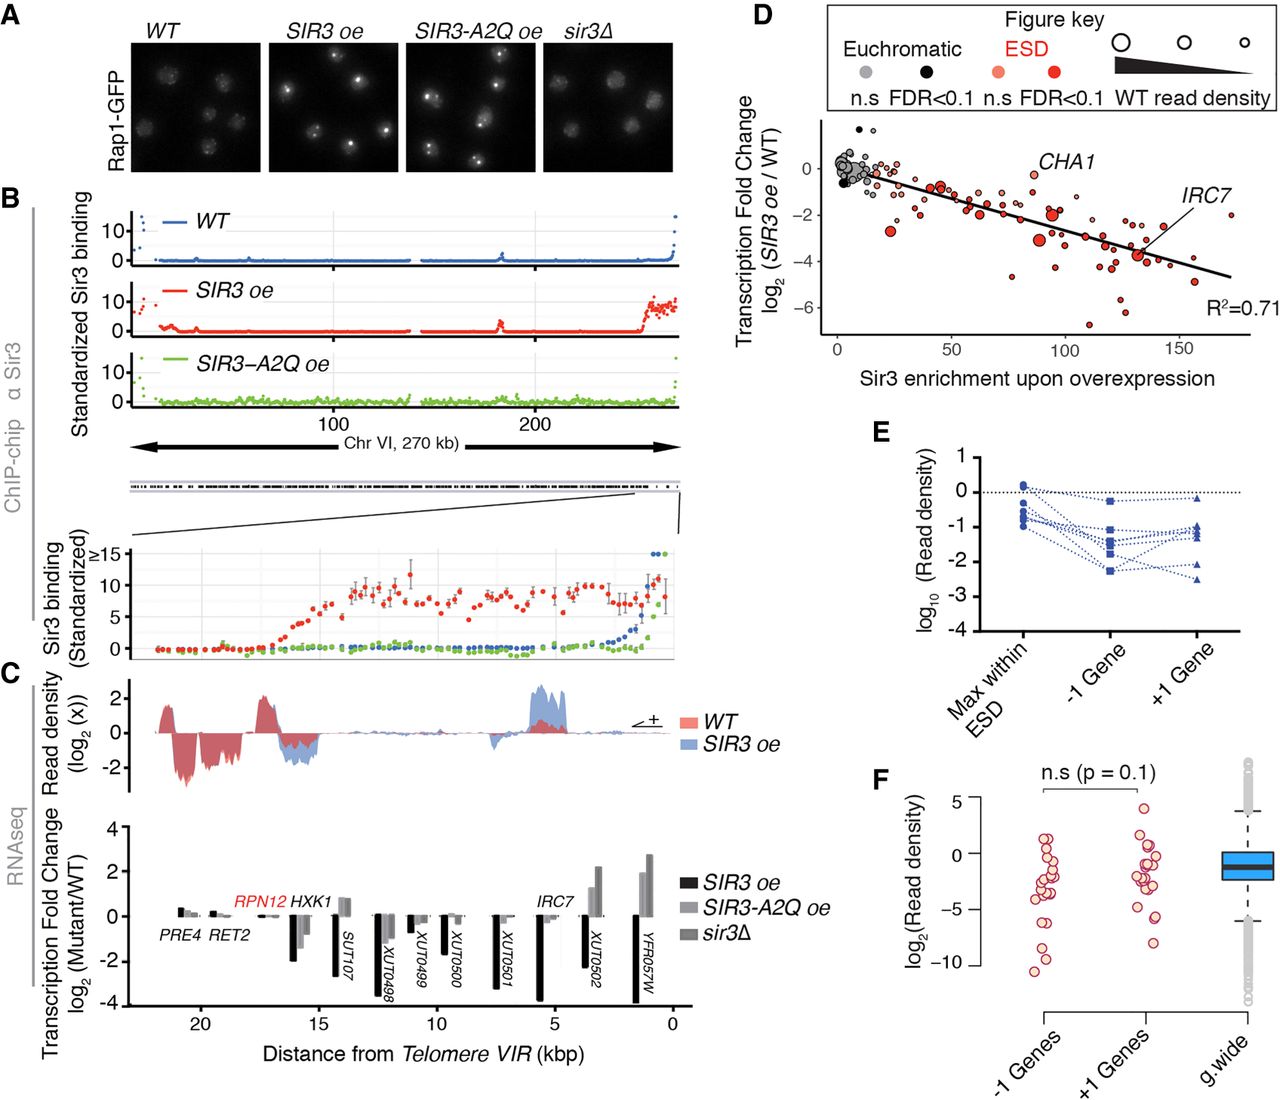
Sir3 extended domains are silenced and restricted to subtelomeres. (A) Representative Rap1-GFP images of exponentially growing strains with different Sir3 amount or expressing the SIR3-A2Q point mutant allele. (B) Chromosome-wide binding of Sir3 in the same strains as in A and blow-up on subtelomere VIR. Enrichment is shown as the standardized IP over input and scale is thresholded at 15 for visualization purposes. (C) Total RNA-seq read density and corresponding transcriptional fold change along subtelomere VIR in indicated exponentially growing (OD600 nm∼1) strains. (D) Sir3 binding and corresponding transcription changes of subtelomeric genes (distance from chromosome end <50 kb) upon overexpression of SIR3. Genes showing infinite fold change values were excluded from this plot. Color code indicates if a gene is annotated as within ESDs (see Methods) and shade indicates significance (FDR < 0.1) of the detected changes. Read density in WT cells is proportional to the disk area. Black line corresponds to linear fitting of the data, and corresponding R2 value is shown. (E) Exemplification of the seven subtelomeres at which a gene within the ESD shows larger transcript amount than the genes located at the end of the domain. (F) Read density of genes located before and after the end of extended silent domains compared to genome-wide distribution, statistical test: Wilcoxon test, paired values.


