
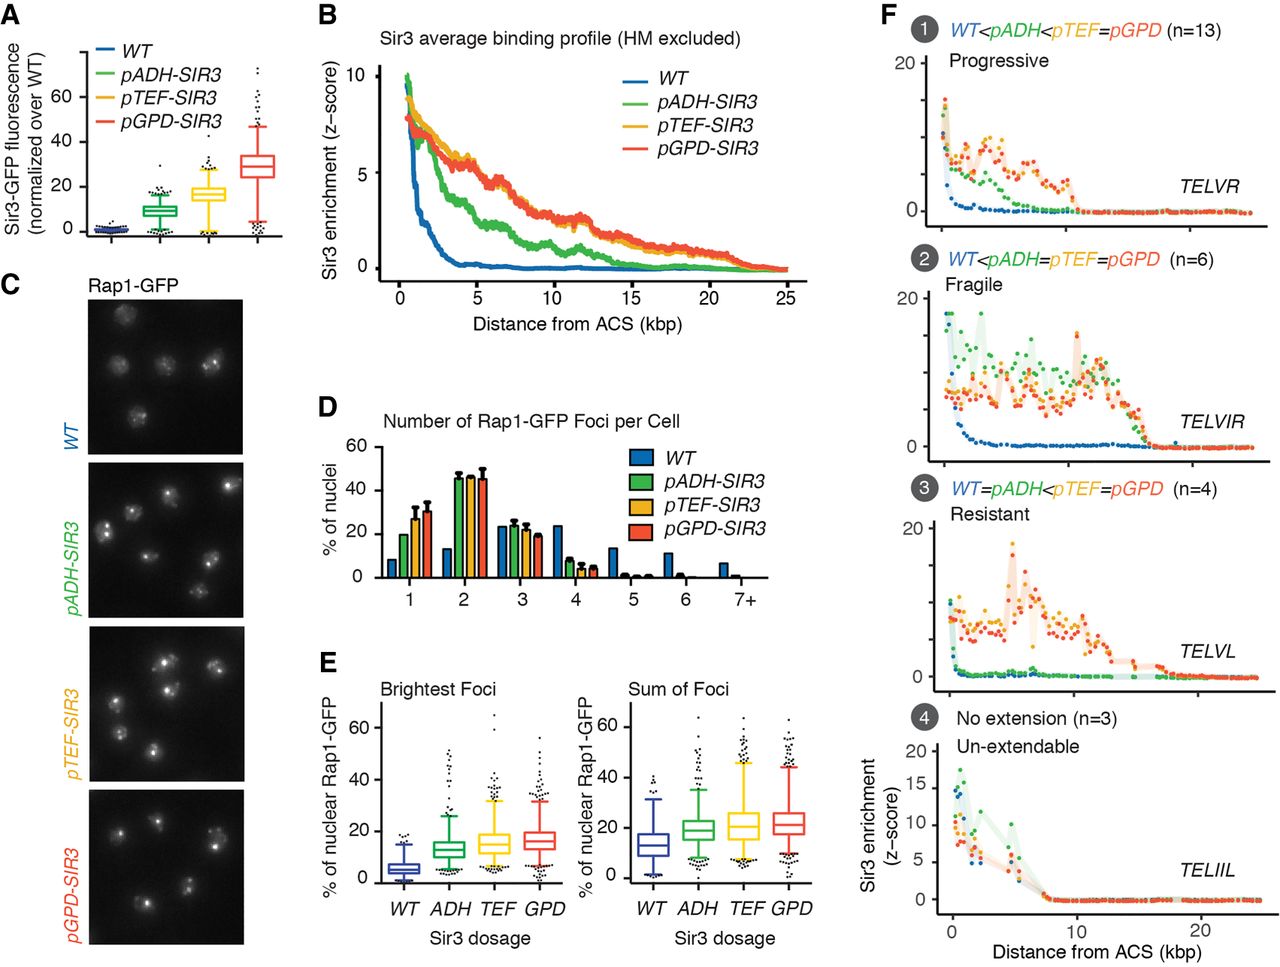
Increasing Sir3 dosage leads to telomere clustering and Sir3 spreading saturation. (A) Quantification of Sir3 levels by integration of Sir3-GFP signal in strains expressing SIR3-GFP under different promoters as indicated. (B) ChIP-chip against Sir3 was carried in strains expressing SIR3 under different promoters as indicated. Moving average of Sir3 binding (block = 1000 bp, window = 10 bp) at telomeres (with the exception of TELIIIL and TELIIIR that contain HM loci) as a function of distance from the ARS consensus sequence (ACS) within the last telomeric element. Enrichment is shown as the standardized IP over Input (see Methods). (C) Rap1-GFP foci grouping in strain differing for Sir3 levels. Cells were grown in YPD overnight, diluted to OD600 nm = 0.2 and imaged at OD600 nm = 1. (D) Quantification of Rap1-GFP foci distribution in images from C. (E, left) Distribution of Rap1-GFP signal attributed to the brightest foci in each nucleus; (right) distribution of the relative amount of Rap1 measured within foci relative to total nuclear Rap1 signal. (F) Stereotypical examples of Sir3 binding in function of Sir3 dosage. Enrichment corresponds to standardized Sir3 binding (Z-score). The number of subtelomeres within each group is shown in parentheses.


