
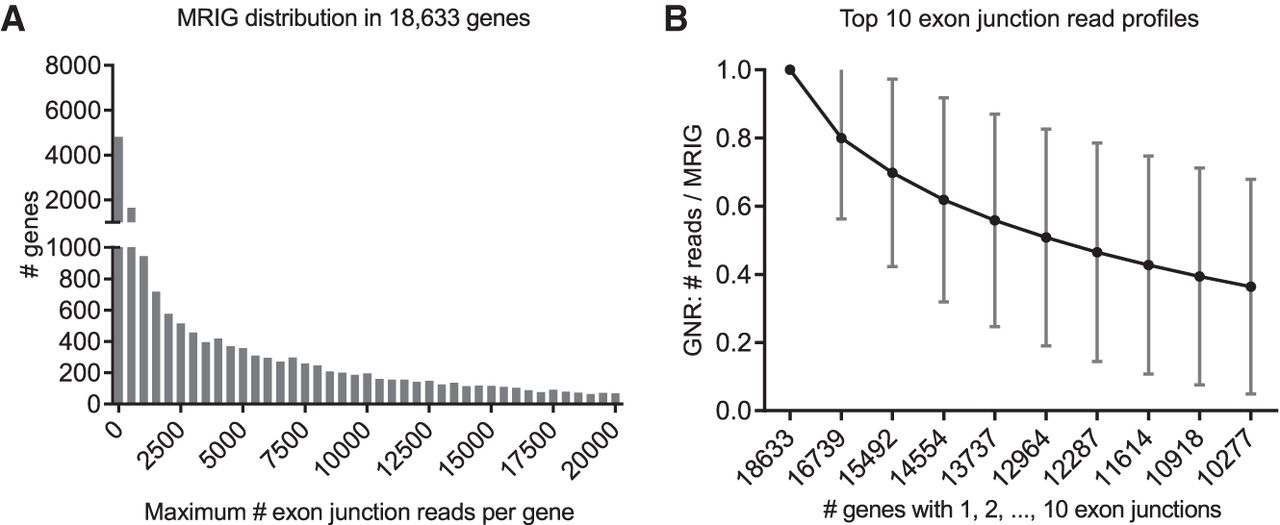
Figure 5.
Distributions of 269,360 exon junctions in 18,633 genes. (A) Distribution of the maximum number of reads on a single exon junction (MRIG) for all 18,633 genes. (B) Profile for top 10 numbers of reads on a single exon junction (mean ± SD). For each gene, exon junctions were ordered by their reads, then normalized by their respective maximum reads in each gene (MRIG) to obtain gene-normalized reads (GNR). Axis labels show the number of genes with at least 1, 2, …, 10 exon junctions. There were, for example, 16,739 genes with two or more exon junctions, and the second highest exon junctions had average GNR of 80%.


