
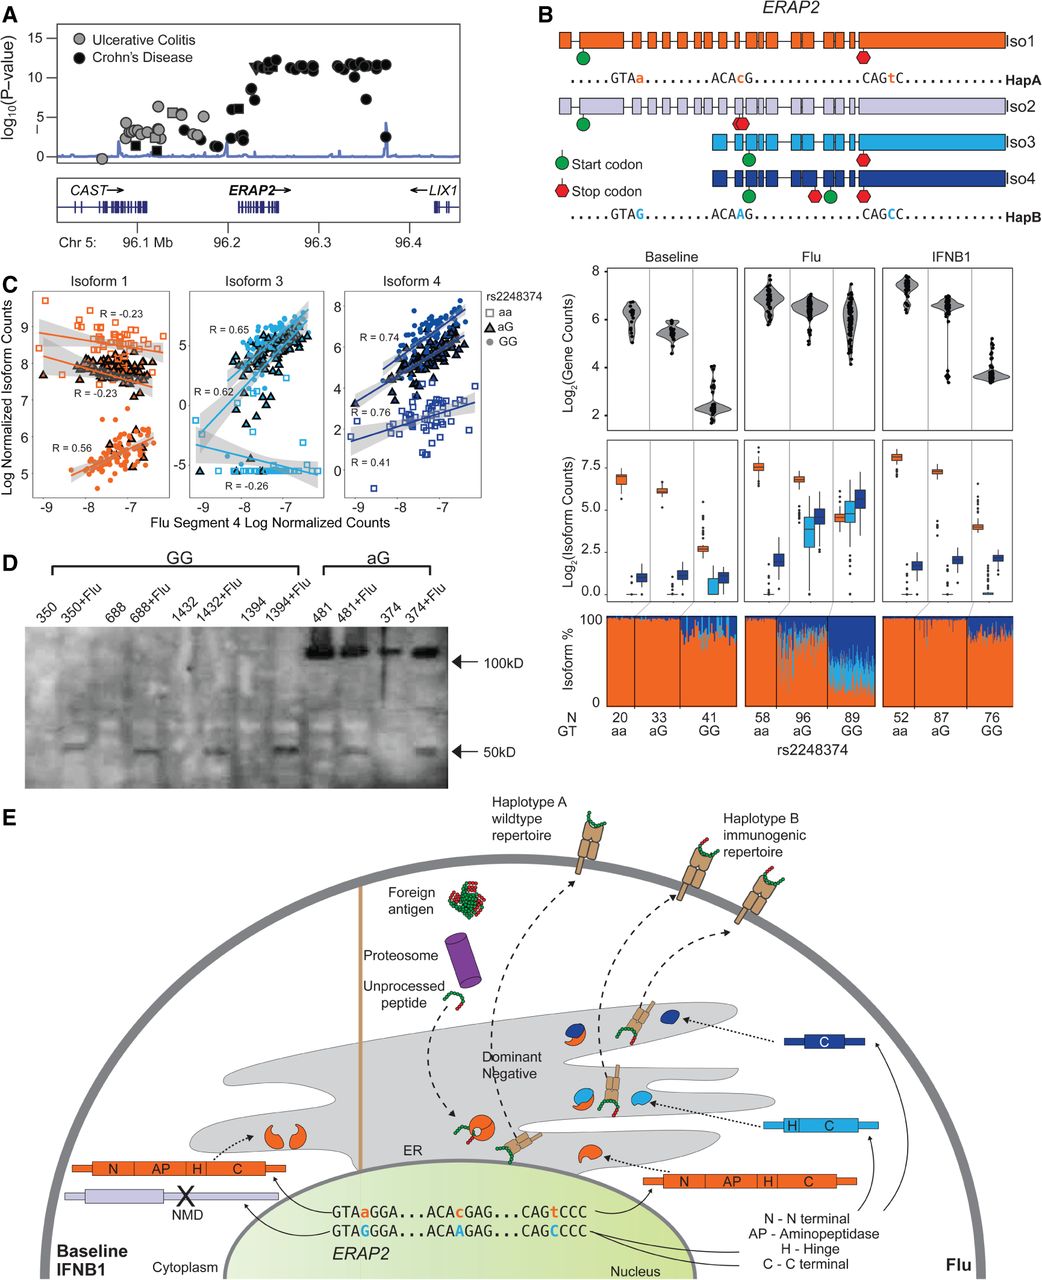
Genetics of ERAP2 regulation. (A) LocusZoom plot of Crohn's disease and ulcerative colitis associations at the ERAP2 locus. (y-axis) −log10(P-value) of association; (x-axis) genomic location. (B) Structures of transcripts derived from each haplotype (top) and box-whisker plots (bottom three panels) between ERAP2 transcript quantitative traits (y-axis: log2(normalized gene abundance), log2(normalized isoform abundance), or isoform usage percentage)) and genotype (x-axis). (C) Correlation between ERAP2/Iso1 (orange), ERAP2/Iso3 (light blue), and ERAP2/Iso4 (dark blue) abundance (y-axis) and abundance of flu segment 4 (x-axis) segregated by rs2248374 genotype (squares indicate aa; triangles, aG; circles, GG). (D) Western blot of MoDCs before and after flu-infection from five Haplotype B homozygotes and two heterozygotes. A full-length ERAP2 protein isoform is expected at 120 kDa. At least one flu-specific ERAP2 protein isoform is expected at 49 kDa. (E) A schematic of the hypothesized regulation and function of two ERAP2 haplotypes. (N) N terminal domain; (AP) amino peptidase domain; (H) hinge domain; (C) C terminal domain; (PTC) premature termination codon.


