
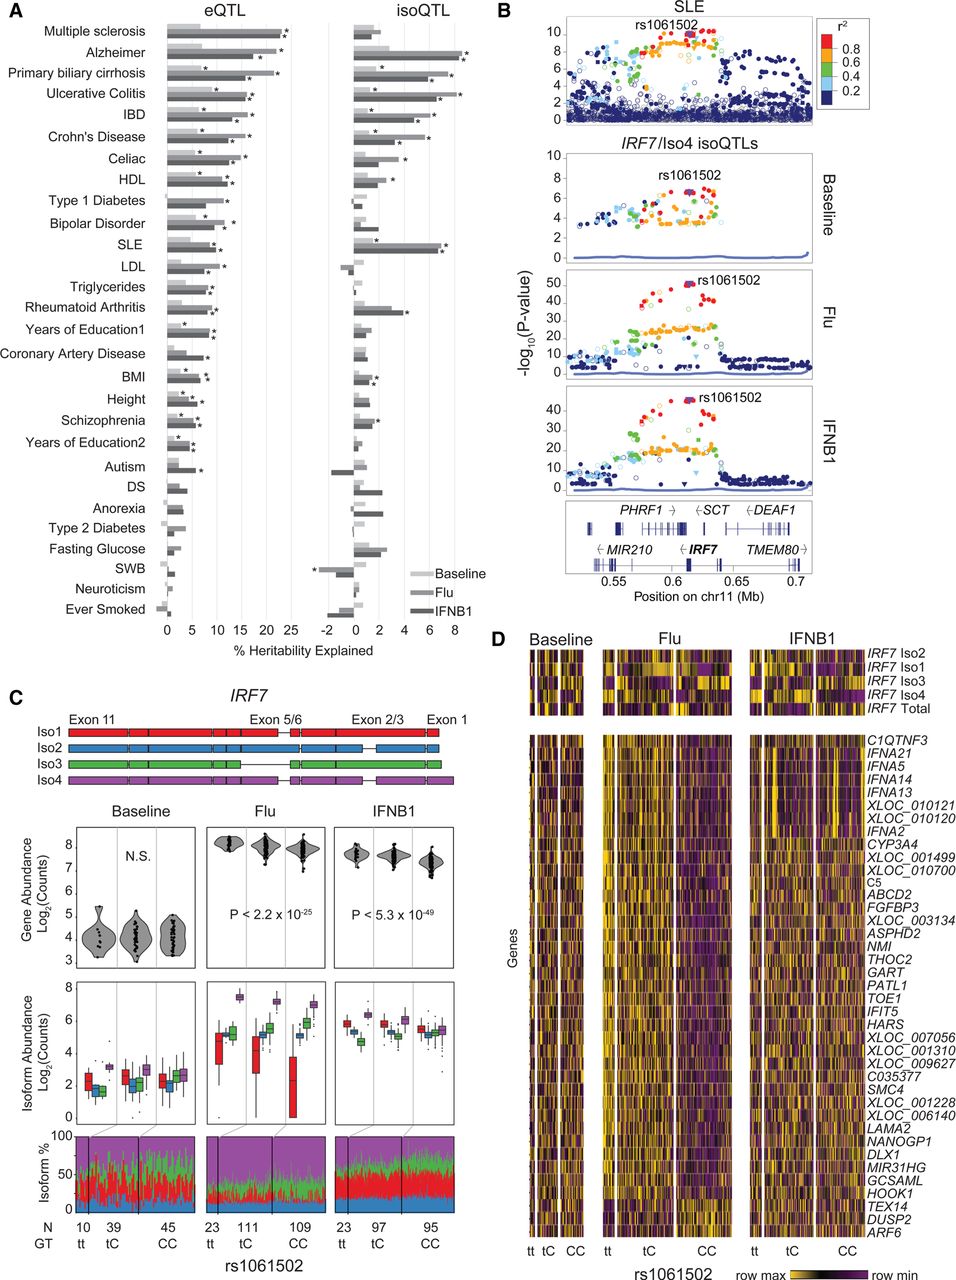
GWAS enrichment of local eQTLs and isoQTLs. (A) Partitioned heritability analysis: proportion of SNP heritability explained (x-axis) for 28 traits (y-axis) by eQTLs (left) and isoQTLs (right). (DS) Depressive symptoms; (SWB) subject well-being; (IBD) inflammatory bowel disease; (SLE) systemic lupus erythematosus; (BMI) body mass index; (HDL) high density lipoprotein; (LDL) low density lipoprotein. (B) LocusZoom plots of the IRF7 region for SLE GWAS associations (top) and IRF7/Iso4 isoQTLs for baseline, flu-infected, or IFNB1-stimulated cells (bottom three panels). (y-axis) −log10(P-value) of association; (x-axis) genomic location. Points are colored based on LD to rs1061502. (C) Transcript structure (top) and box-whisker plots (bottom three panels) between IRF7 transcript quantitative traits (y-axis: log2(normalized gene abundance), log2(normalized isoform abundance), or isoform usage percentage) and rs1061502 genotype (x-axis). (D) Heatmap of genes distally associated (permutation FDR < 0.05) with risoQTL rs1061502. Heatmap colors are row-scaled TPM values (yellow indicates row maximum; purple indicates row minimum).


