
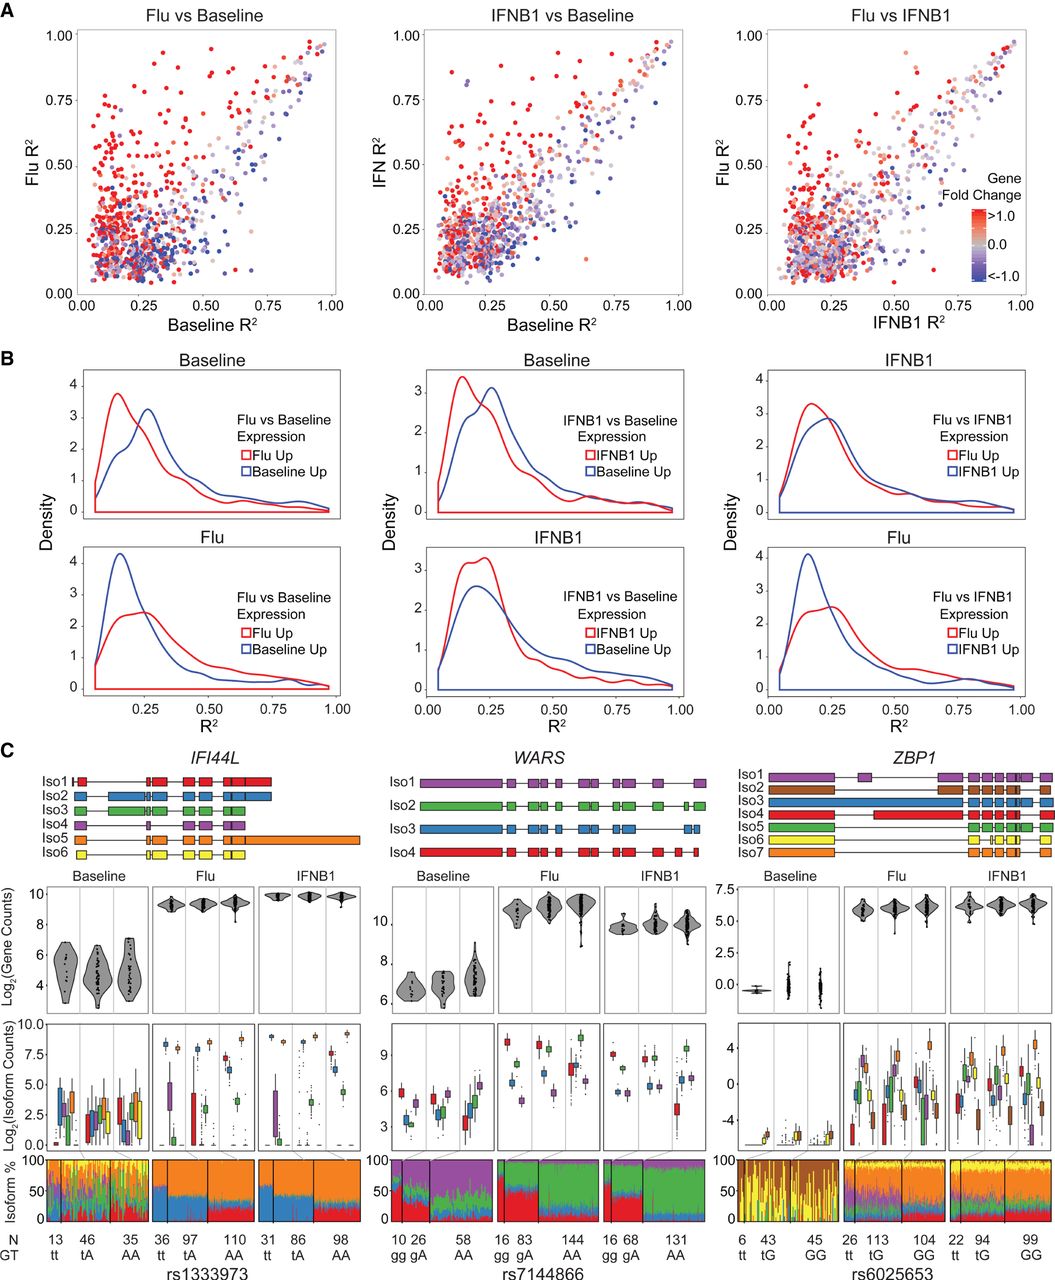
Comparison of local isoQTLs between conditions. (A) Correlation of effect sizes (R2) for significant local isoQTLs (permutation FDR < 0.05) between pairs of conditions. Transcripts are colored by differential expression (red indicates up-regulated in condition 2, y-axis; blue indicates up-regulated in condition 1, x-axis) for each pair of conditions. (B) Distributions of effect sizes (R2) for significant local isoQTLs (permutation FDR < 0.05) for each pair of conditions segregating genes based on expression in each condition. (C) De novo constructed transcript structure (top) and box-whisker plots (bottom three panels) between transcript quantitative traits (y-axis: log2(normalized gene abundance), log2(normalized isoform abundance), or isoform usage percentage) and genotype (x-axis) for three genes (IFI44L, WARS, and ZBP1) with risoQTLs.


