
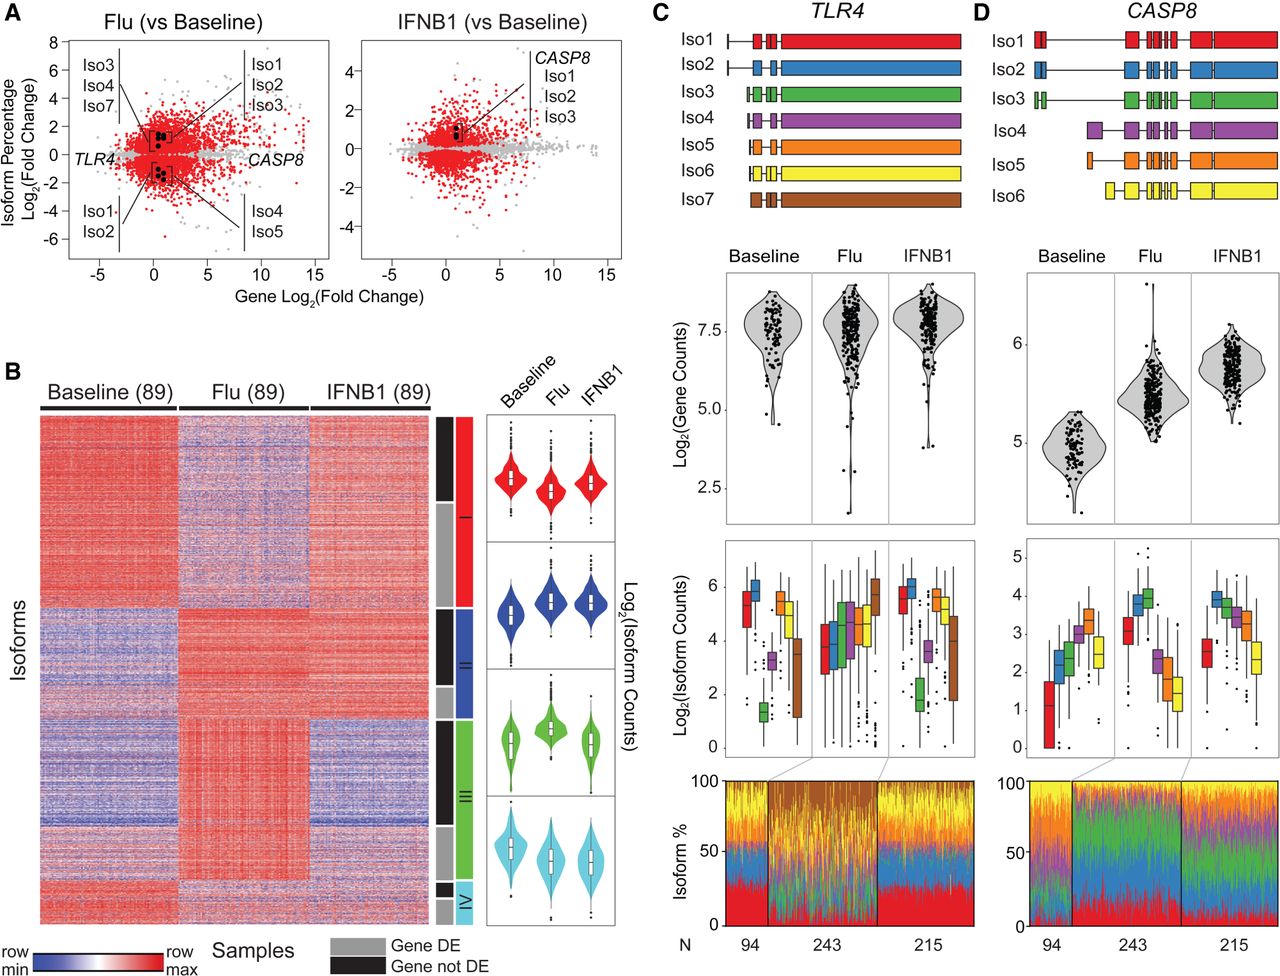
Transcriptome changes in response to stimulation. (A) Scatter plot of log2 fold change of gene abundance (x-axis) versus log2 fold change of isoform usage percentage (y-axis) in flu-infected (left) and IFNB1-simulated (right) cells compared with baseline. Each dot represents one isoform. Isoforms that significantly differed in their usage (beta regression, FDR < 0.05) are highlighted in red. (B) Clustering of isoform usage ratios in baseline, flu-infected, and IFNB1-stimulated cells. Heatmap colors are row scaled (red indicates row maximum, blue indicates row minimum; left). Violin plots (right) summarize the usages of all isoforms within a cluster separated by condition. Only isoforms (one per gene) that most significantly changed (beta regression, FDR < 0.05) in usage are shown. (C,D) De novo constructed isoforms (top), gene abundance (second row), and isoform abundance (third row) and usage percentage (bottom) for TLR4 (C) and CASP8 (D).


