
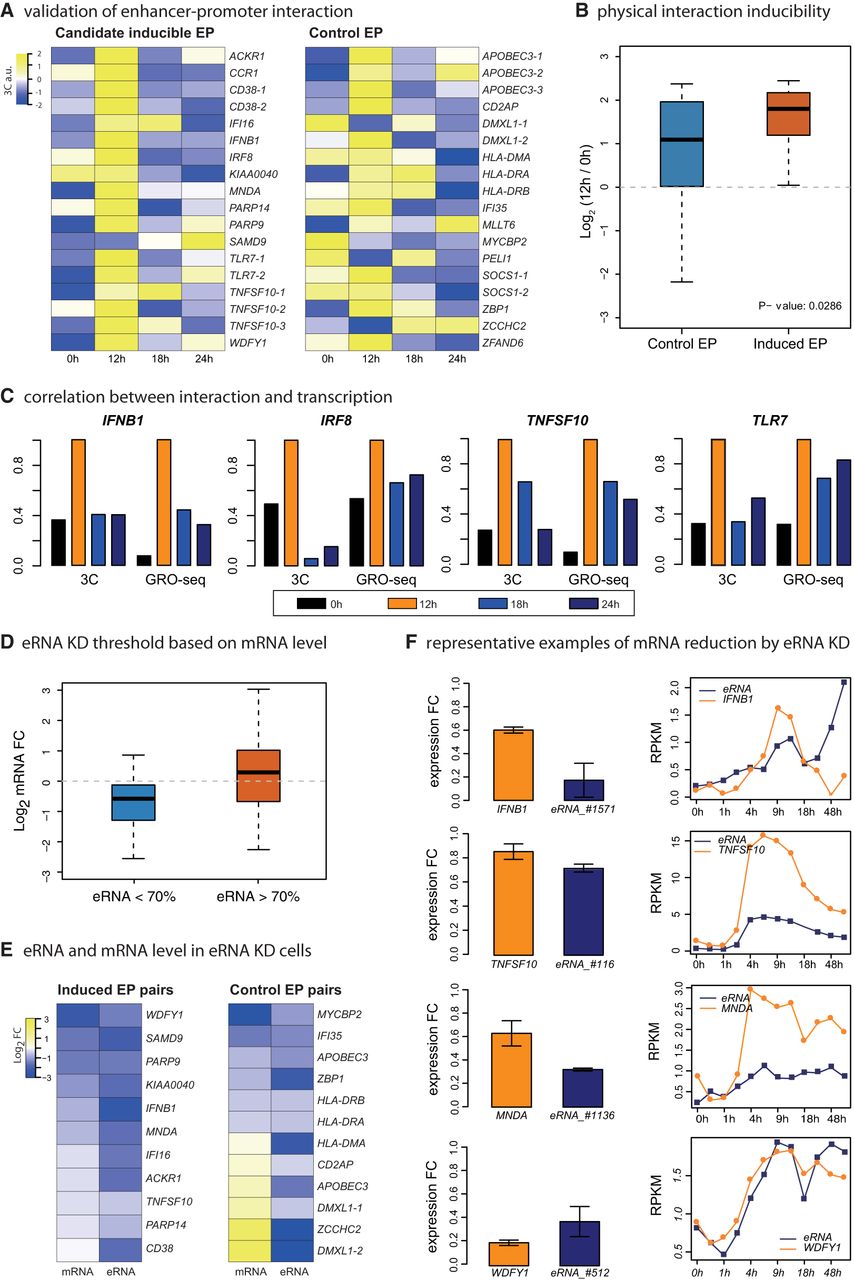
Effects of eRNA KD on target genes. (A) Heat maps of 3C signals for 18 inducible EP pairs and 18 control EP pairs within 200 kb are shown. Signals are normalized by BAC 3C interaction frequency. (B) Box plot of 3C log fold changes is shown (12 h vs. 0 h) for control and induced EP pairs with P-values from Kolmogorov–Smirnov (KS) test. (C) Representative examples of 3C results are shown and compared with GRO-seq signal (RPKM) of the corresponding immune-related genes. (D) Box plot shows mRNA fold changes for successful eRNA KD (eRNA < 70%) and unsuccessful eRNA KD (eRNA > 70%). (E) Heat map shows mRNA/eRNA log fold changes; 11 inducible EP pairs and 12 control pairs are included. (F) Representative examples of EP pairs where eRNA KD led to mRNA repression. mRNA/eRNA expression levels were measured by RT-qPCR. y-axes of expression curves represents GRO-seq signal (RPKM).


