
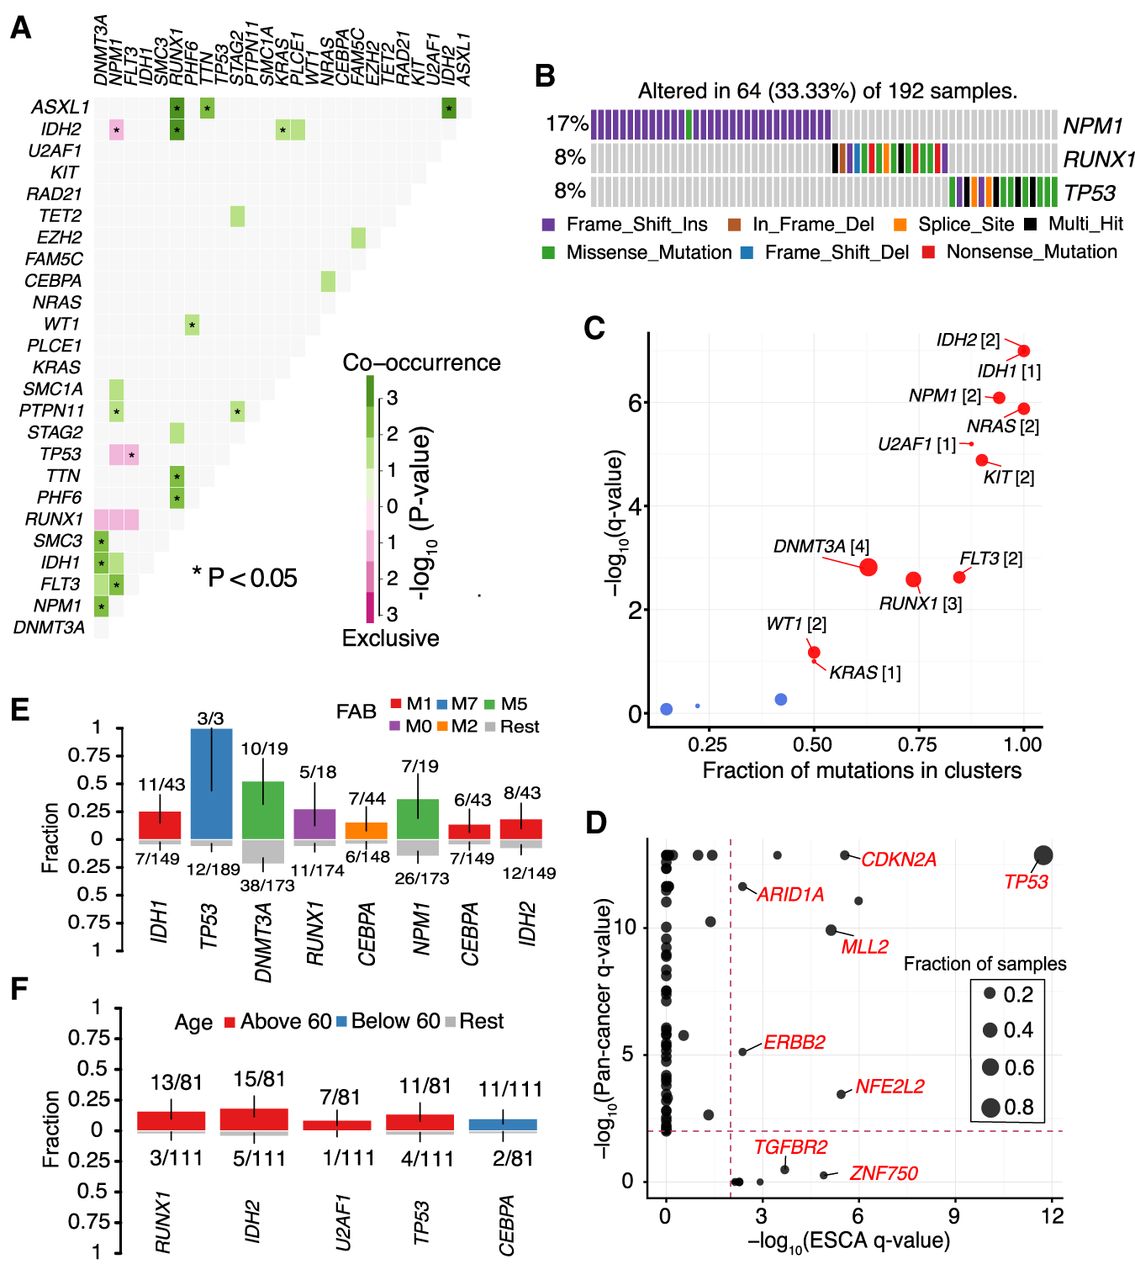
Pathway and clinical enrichment analysis. (A) Mutually exclusive and co-occurring gene pairs in AML displayed as a triangular matrix. Green indicates tendency toward co-occurrence, whereas pink indicates tendency toward exclusiveness. (B) Significantly altered pathway identified in AML by CoMEt exact test involving NPM1, RUNX1, and TP53 genes mutated in mutually exclusive manner (P < 0.001). (C) Disease-associated driver genes identified by oncodrive in TCGA AML cohort (FDR < 0.1). Number of closely spaced mutational clusters are highlighted within brackets. (D) Pan cancer comparison of significantly mutated genes in ESCA identified by MutSigCV against Pan cancer driver genes. TGFBR2 and ZNF750 are exclusively mutated in esophageal cancer, whereas other drivers, such as TP53, and CDKN2A, are mutated in the global pan cancer cohort. (E,F) Bar plots displaying the association between genes and clinical features, French–American–British (FAB) classification and age group, respectively (P < 0.05, Fisher's exact test). Bars are annotated with the ratio of mutated samples to total samples. Error bars display 95% CI of binomial ratios. The y-axis denotes the fraction of samples associated with the phenotype.


