
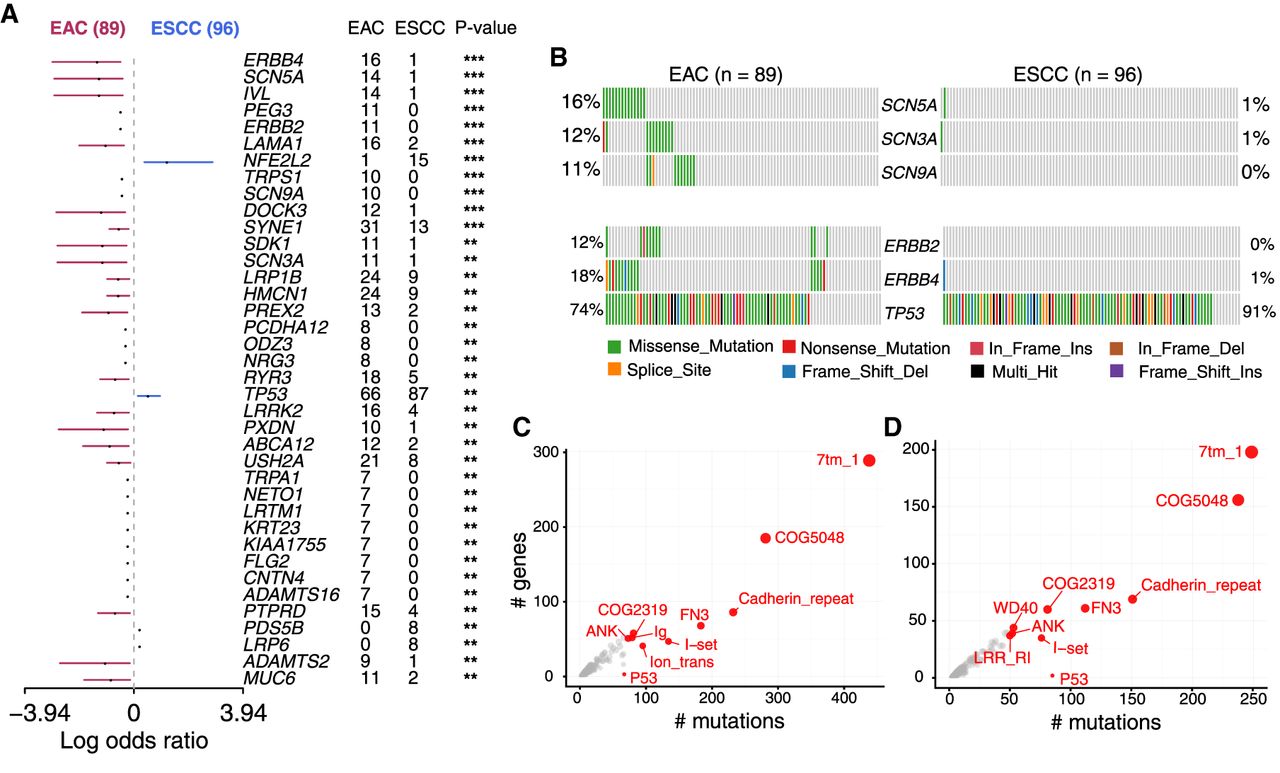
Cohort comparison and domain enrichment analysis. (A) Differentially mutated genes between EAC and ESCC displayed as a forest plot. Bars indicate 95% confidence interval of odds ratio. The adjacent table includes the number of samples in EAC and ESCC with the mutations in the highlighted gene. P-value indicates significance threshold: (***) P < 0.001; (**) P < 0.01; Fisher's exact test. (B) Mutated pathways involving genes associated with VGSC and ERBB signaling in EAC. Genes associated with these pathways are preferentially enriched in EAC, mutated in a mutually exclusive manner. (C,D) Frequently mutated pfam protein domains in EAC and ESCC, respectively. The top ten domains are highlighted. Bubble sizes are proportional to the number of genes containing the highlighted domain. Ion_trans domain is largely mutated in EAC.


