
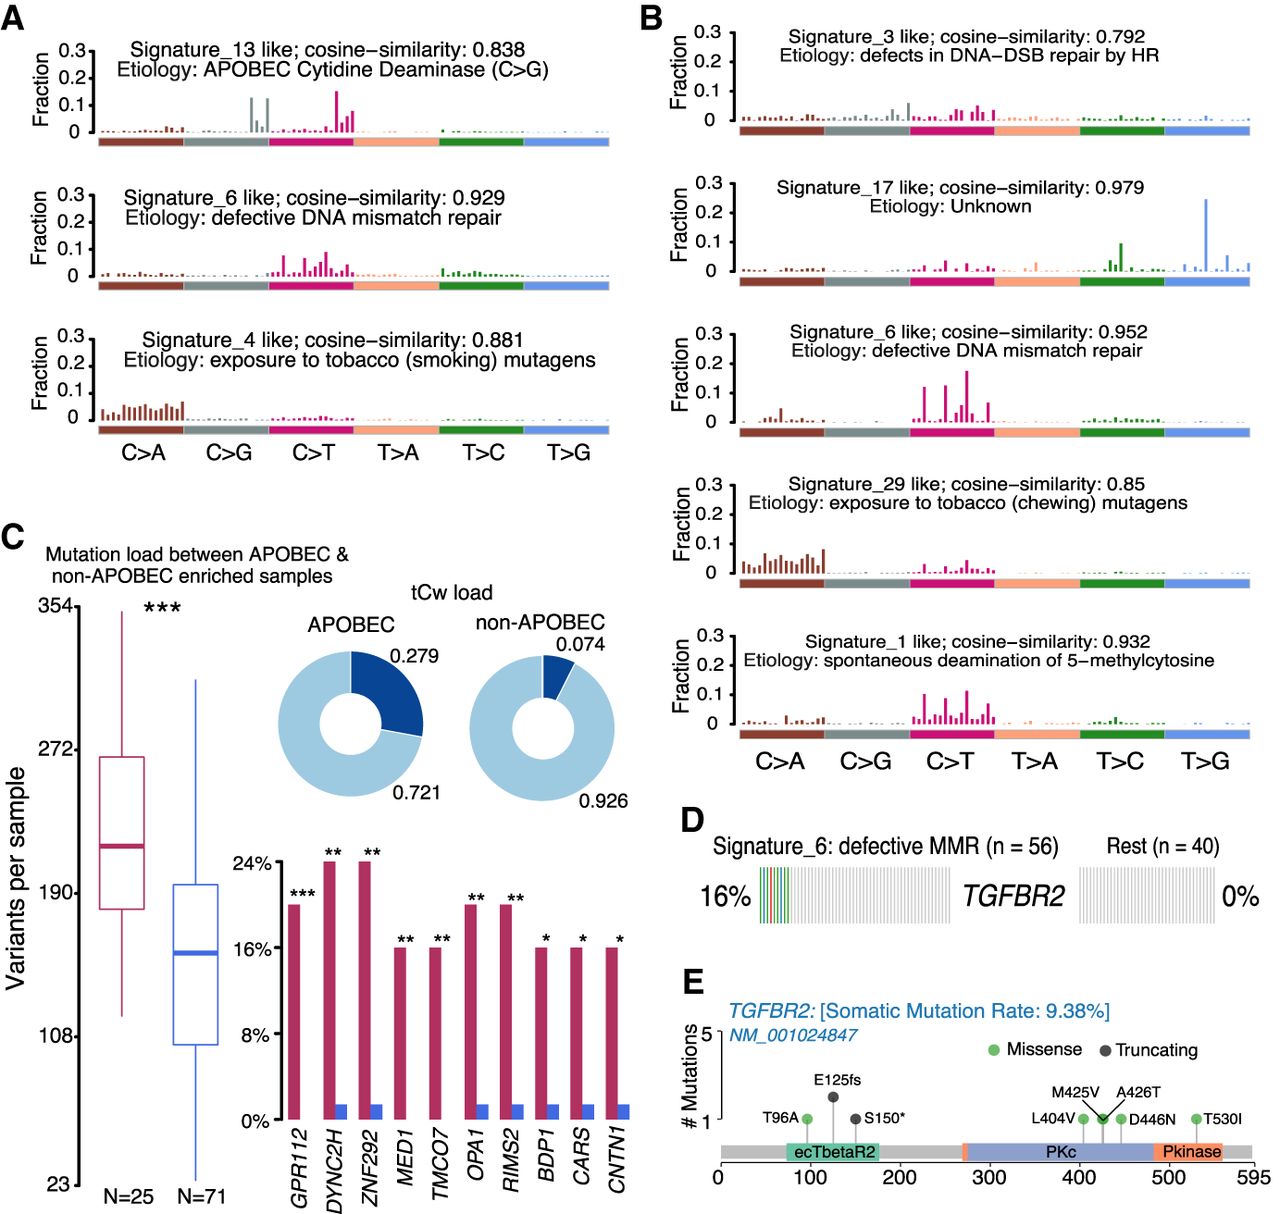
Signature and APOBEC enrichment analysis. (A,B) Mutational signatures identified in ESCC and EAC, respectively. The y-axis indicates exposure of 96 trinucleotide motifs to overall signature. The plot title indicates best match against validated COSMIC signatures and cosine similarity value along with the proposed etiology. (C) Results from the APOBEC enrichment analysis in ESCC. The box plot shows differences in mutation load between APOBEC-enriched and nonenriched samples: (***) Wilcoxon rank-sum test; P < 0.001. Donut plots display the proportion of mutations in tCw context. Bar plots show the top 10 differentially mutated genes between APOBEC-enriched and non-APOBEC-enriched samples: (***) P < 0.001; (**) P < 0.01; (*) P < 0.05, Fisher's exact test. (D) Enriched TGFBR2 mutations in ESCC among samples associated with defects in DNA mismatch repair signature (COSMIC Signature 6). (E) Lollipop plot showing the distribution of mutations in TGFBR2 and truncating mutations (frameshift deletions and splice site) in the BETR2 domain.


